Australian Dollar, AUD/USD, US Dollar, Treasury Yields, ACGB, DXY Index – Talking Points
- The Australian Dollar steadies as risks swirl for markets
- The US Dollar has been underpinned by firm Treasury yields
- Markets appear poised for a busy week. Will AUD/USD recover from the lows?
Recommended by Daniel McCarthy
Get Your Free AUD Forecast
The Australian Dollar has steadied going into the new week after testing recent lows last Friday.
The weakness in AUD/USD is mostly a result of the US Dollar regaining the ascendency with Treasury yields continuing to remain buoyant.
The benchmark 10-year bond finished last week oscillating above 4.60%, not far from the 16-year peak of 4.88% seen earlier this month.
In a similar vein, the 2-year note, which is more sensitive to the Fed funds target rate, continues to trade above 5%. The 5.20% seen last month was the highest since 2006.
In comparison, the 2- and 10-year Australian Commonwealth Government bonds (ACGB) are yielding around 4.05% and 4.45% respectively.
However, recent movements in the spread between Australian and US government bonds highlight that it is the strengthening of the US Dollar rather than the interest rate differential that appears to have more influence over AUD/USD.
Then by extension, nominal Treasury yields appear to have more sway than the spread for the Aussie Dollar.
AUD/USD AND DXY (USD) INDEX AGAINST AU AND US BONDS
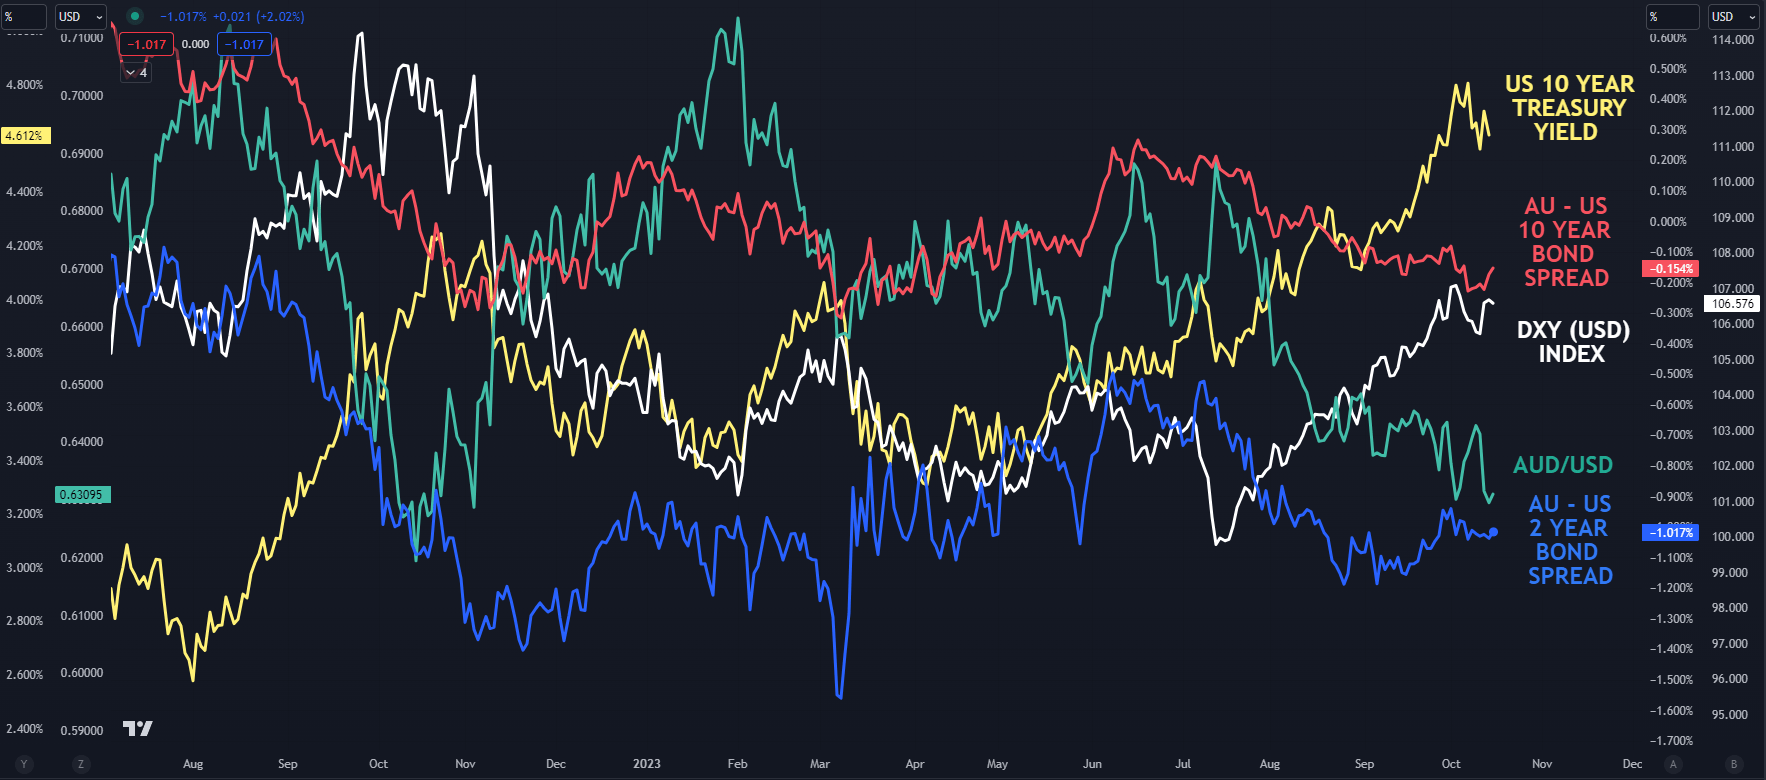
Chart created in TradingView
Elsewhere, risk assets are under the microscope with geopolitical events in the Middle East creating some uncertainty for markets.
Crude oil and other energy commodities have found some support as well as perceived haven currencies such as the Swiss Franc.
Spot gold has also traded back above US$ 1,920 an ounce but industrial metals are languishing somewhat.
The US Dollar has opened slightly softer across the board to start the week in the Asian session, and it is possible that markets could be in for a volatile week ahead.
This Thursday will see Australian unemployment data and it is forecast to remain near multi-generational lows at around 3.7% for the September read.
AUD/USD TECHNICAL ANALYSIS
AUD/USD bounced off the low of 0.6286 to start the week and if the price fails to move below that level, a Double Bottom might be in place.
Overall, it remains in a descending trend channel and bearish momentum might be intact for now.
A bearish triple moving average (TMA) formation requires the price to be below the short-term Simple Moving Average (SMA), the latter to be below the medium-term SMA and the medium-term SMA to be below the long-term SMA. All SMAs also need to have a negative gradient.
When looking at any combination of the 10-, 21-, 55- 100- and 200-day SMAs, the criteria for a bearish TMA have been met and might suggest that bearish momentum is evolving. To learn more about trend trading, click on the banner below.
Recommended by Daniel McCarthy
The Fundamentals of Trend Trading
Last Wednesday’s high of 0.6447 coincided with the 55-day Simple Moving Average (SMA) and that level may offer resistance ahead of a cluster of prior peaks in the 0.6500 – 0.6510 area.
Further up, the 0.6600 – 0.6620 area might be another resistance zone with several breakpoints and previous highs there.
On the downside, support may lie near the previous lows of 0.6286, 0.6272 and 0.6170.
The latter might also be supported at 161.8% Fibonacci Extension level at 0.6186.
AUD/USD DAILY CHART
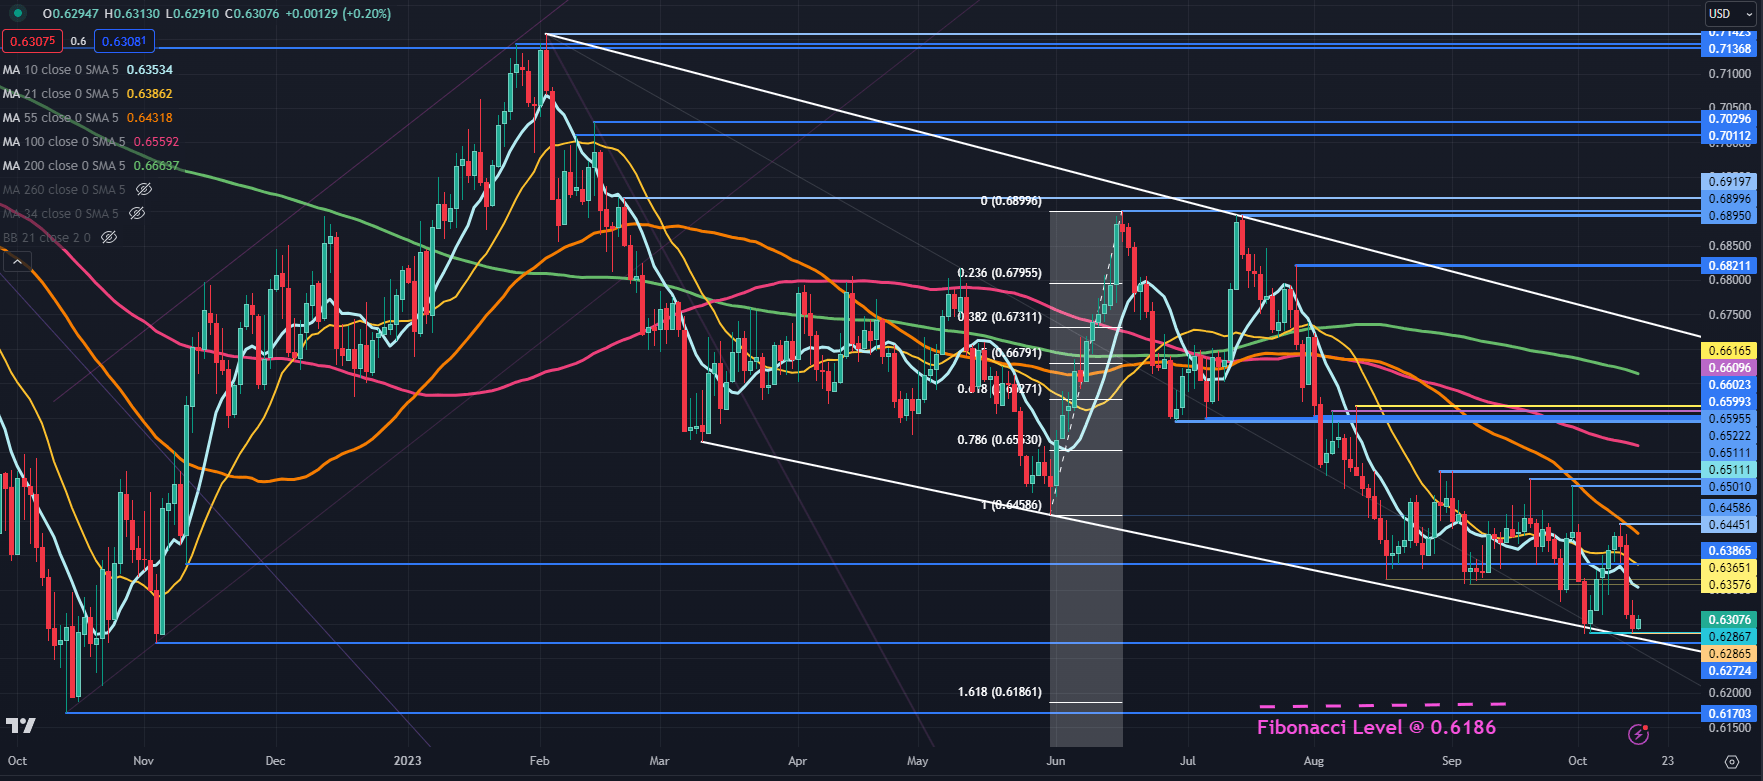
Chart created in TradingView
Trade Smarter – Sign up for the DailyFX Newsletter
Receive timely and compelling market commentary from the DailyFX team
Subscribe to Newsletter
— Written by Daniel McCarthy, Strategist for DailyFX.com
Please contact Daniel via @DanMcCarthyFX on Twitter