Japanese Yen Prices, Charts, and Analysis
- USD/JPY – Will a break of 155.00 wake up the Bank of Japan?
- GBP/JPY – A fresh, short-term high?
Japanese Yen Q2 Forecasts: Unlock Exclusive Insights into Key Market Catalysts for Traders
Recommended by Nick Cawley
Get Your Free JPY Forecast
The Bank of Japan is seemingly comfortable sitting on the sidelines and watching the Yen drift ever lower, despite the occasional bout of verbal intervention. Over the last few weeks, the Japanese central bank has voiced its concern over the weakness of the Yen, warning that they are closely watching market moves and volatility, but words it seems are no longer enough to prop up the currency. USD/JPY remains close to an all-time high, while GBP/JPY is setting up for a technical push higher.
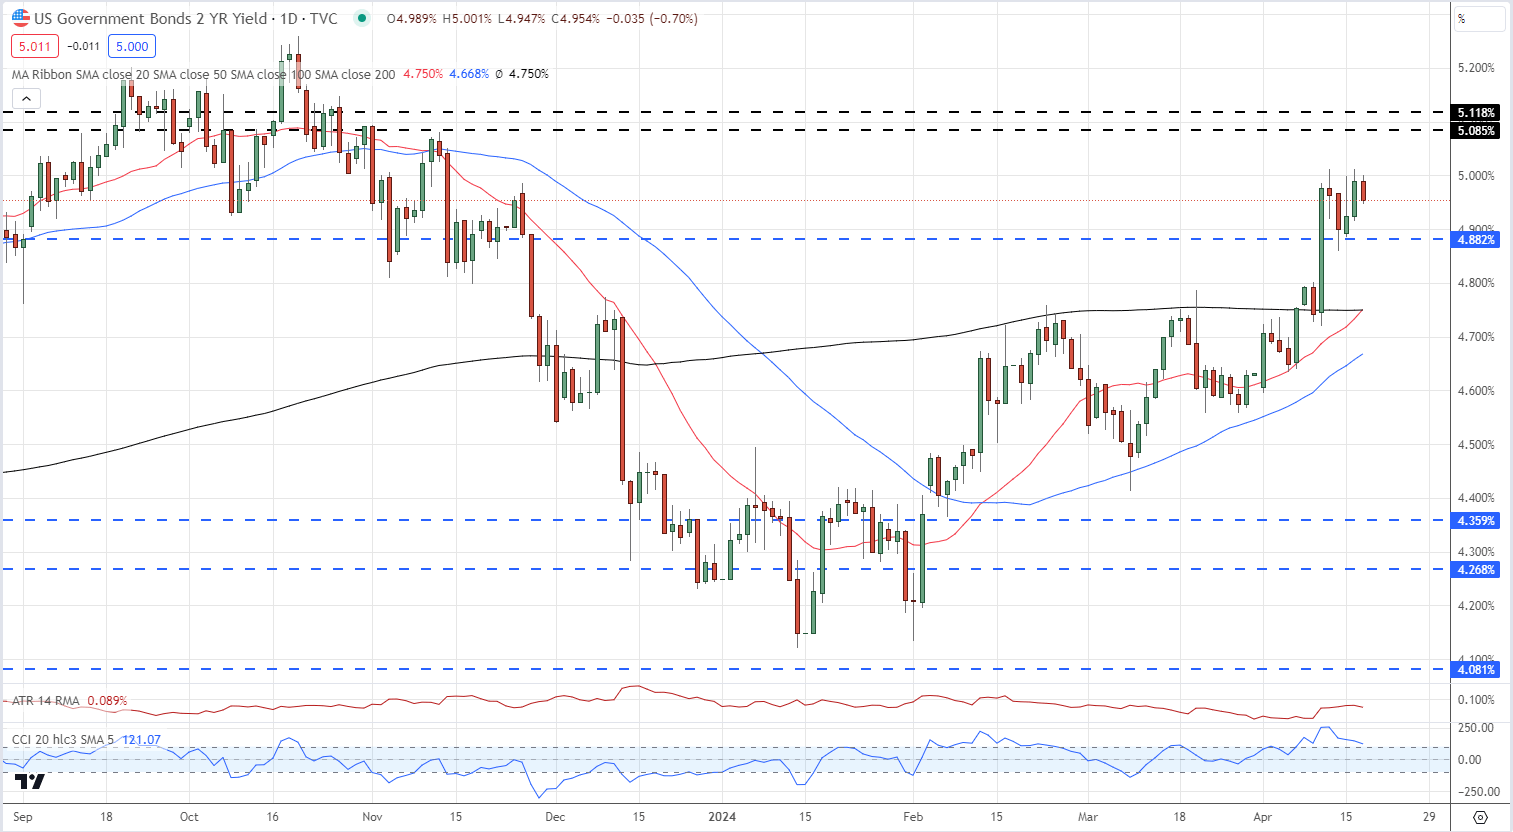
The consensus view that 155.00 is a ‘line in the sand’ for USD/JPY and will trigger a response by the Bank of Japan, is being tested, especially as the US dollar pushes ever higher. While the Yen remains weak, the US dollar has rallied sharply in the last few days as traders pushed back expectations of when the Federal Reserve will start cutting rates. This hawkish reset has seen US Treasury yields rally to multi-month highs, with the yield on the rate-sensitive UST 2-year hitting 5% on Tuesday. The current technical setup on the UST 2-year is bullish after a clean break above the 200-day sma, while the 20-dsma is looking to move above the longer-dated moving average. A potential bullish flag and pole setup is currently being made and traders should monitor this setup in the coming days.
US Treasury Two-Year Yield
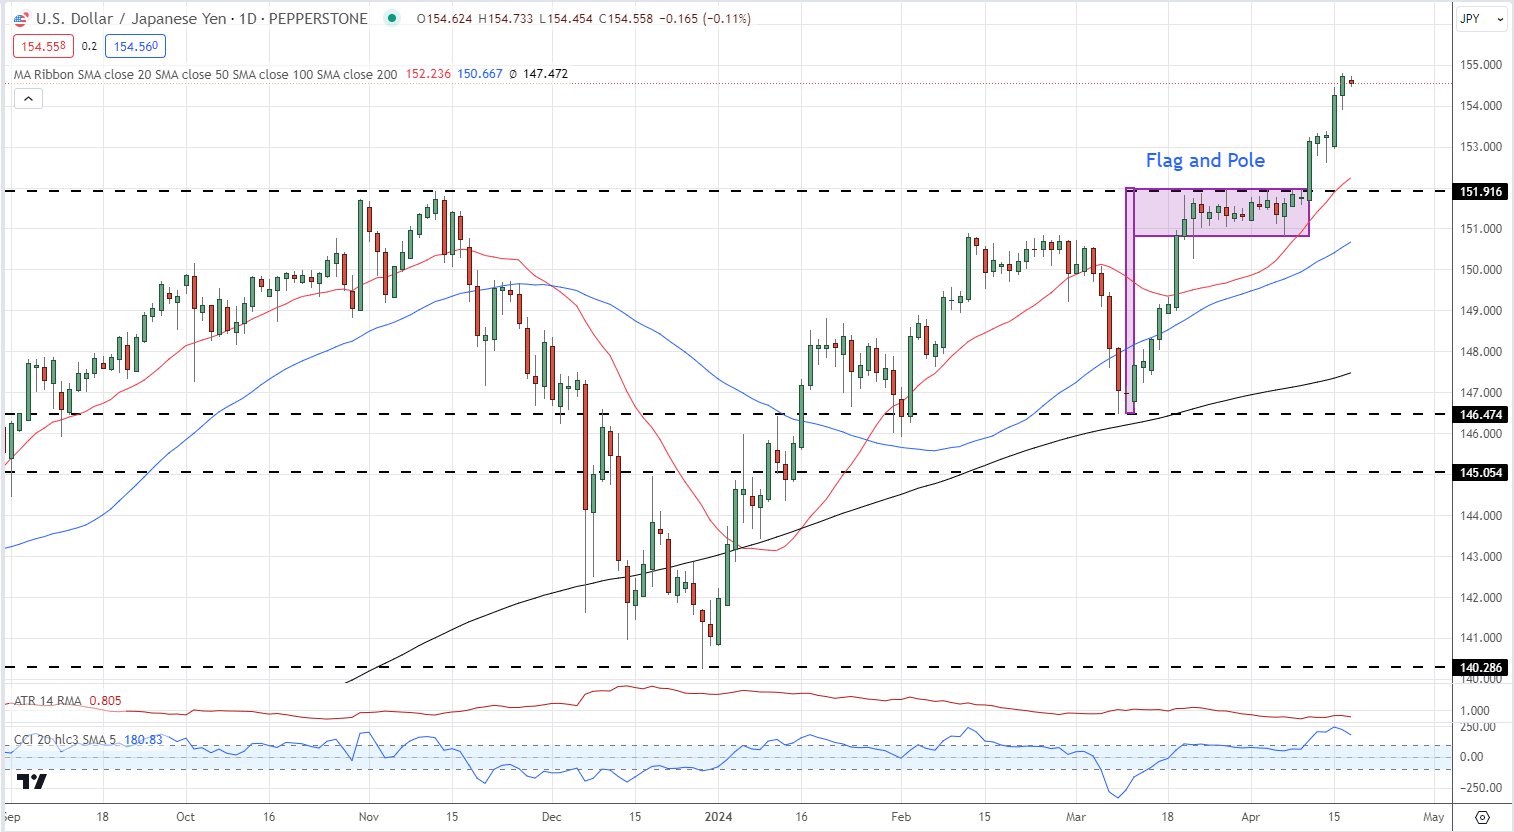
A bullish flag and pole setup is being played out on the daily USD/JPY chart and suggests that the pair may move higher and above 155.00. As discussed earlier, this is seen as a potential intervention target so traders need to be aware of any official BoJ chatter. If the central bank allows USD/JPY to move higher, then 160.00 becomes the next target. Prior resistance at 151.92 is now the first level of support.
USD/JPY Daily Price Chart
Retail trader data shows 16.19% of traders are net-long with the ratio of traders short to long at 5.18 to 1.The number of traders’ net long is 2.26% lower than yesterday and 6.04% higher than last week, while the number of traders’ net short is 3.74% higher than yesterday and 2.22% lower than last week.
We typically take a contrarian view to crowd sentiment, and the fact traders are net-short suggests USD/JPY prices may continue to rise.
Download the Latest IG Sentiment Report and discover how daily and weekly shifts in market sentiment can impact the price outlook:
| Change in | Longs | Shorts | OI |
| Daily | -8% | 5% | 3% |
| Weekly | 4% | -3% | -2% |
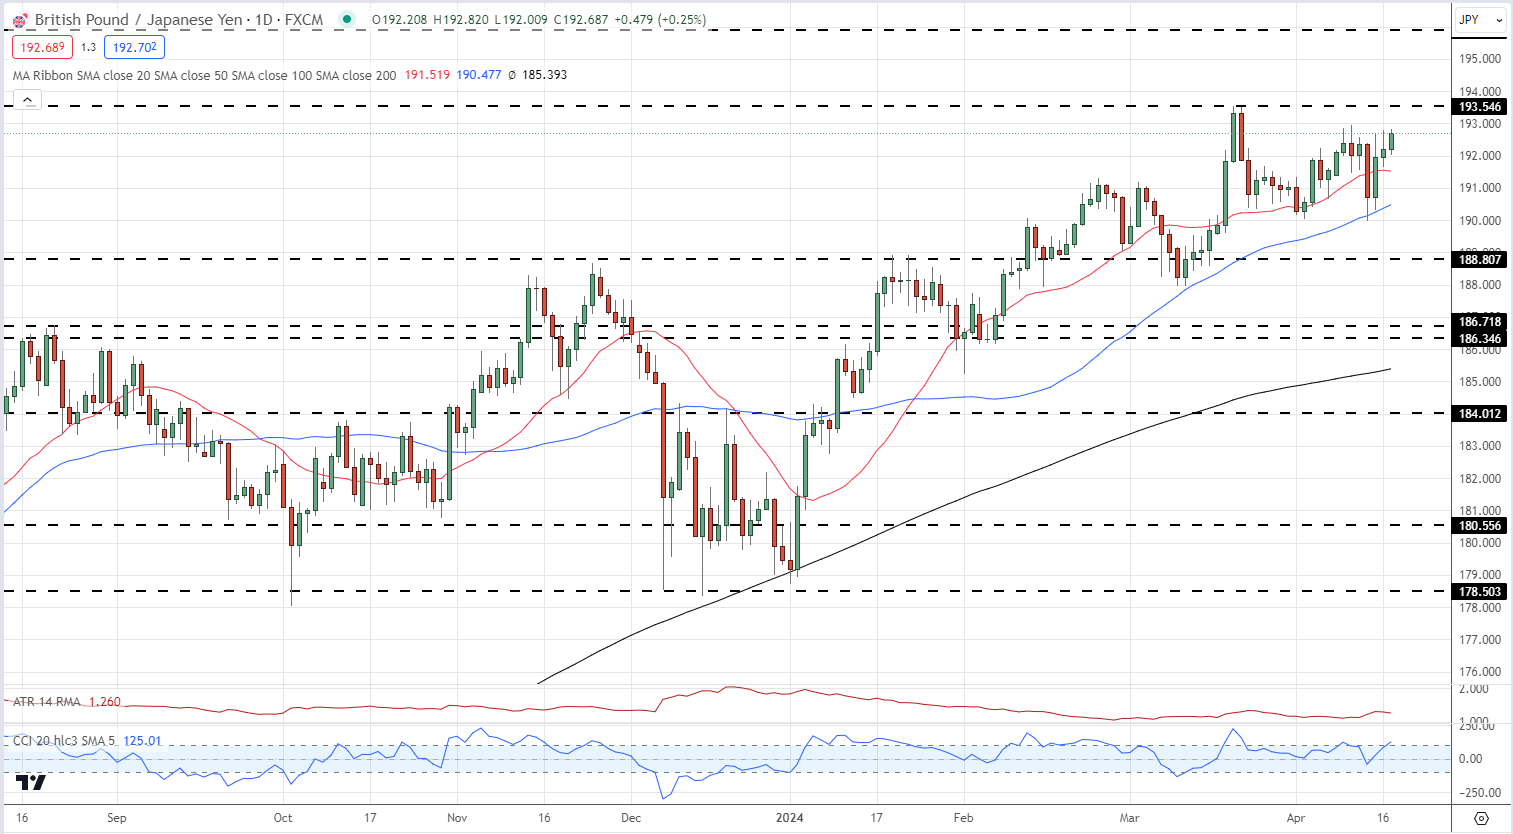
GBP/JPY continues to post an unbroken series of higher lows, and a break above the mid-to-late March double top around 193.50 would continue a series of higher highs. Above here, the June 2015 high at 195.88 heaves into view. Initial support is around 191.00.
GBP/JPY Daily Price Chart
What is your view on the Japanese Yen – bullish or bearish?? You can let us know via the form at the end of this piece or contact the author via Twitter @nickcawley1.