Most Read: Decoding Fedspeak: How Central Banker Comments Move Markets – Gold & US Dollar
The U.S. dollar, as measured by the DXD index, climbed to multi-month highs earlier this, fueled by mounting evidence that the Fed may wait a little longer before dialing back on policy restraint. Tight labor markets and persistent inflation have shattered hopes of rapid and deep rate cut later this year, pushing Treasury yields sharply higher, with the 2-year note coming within striking distance from recapturing the 5.0% psychological level.
US DOLLAR INDEX WEEKLY PERFORMANCE
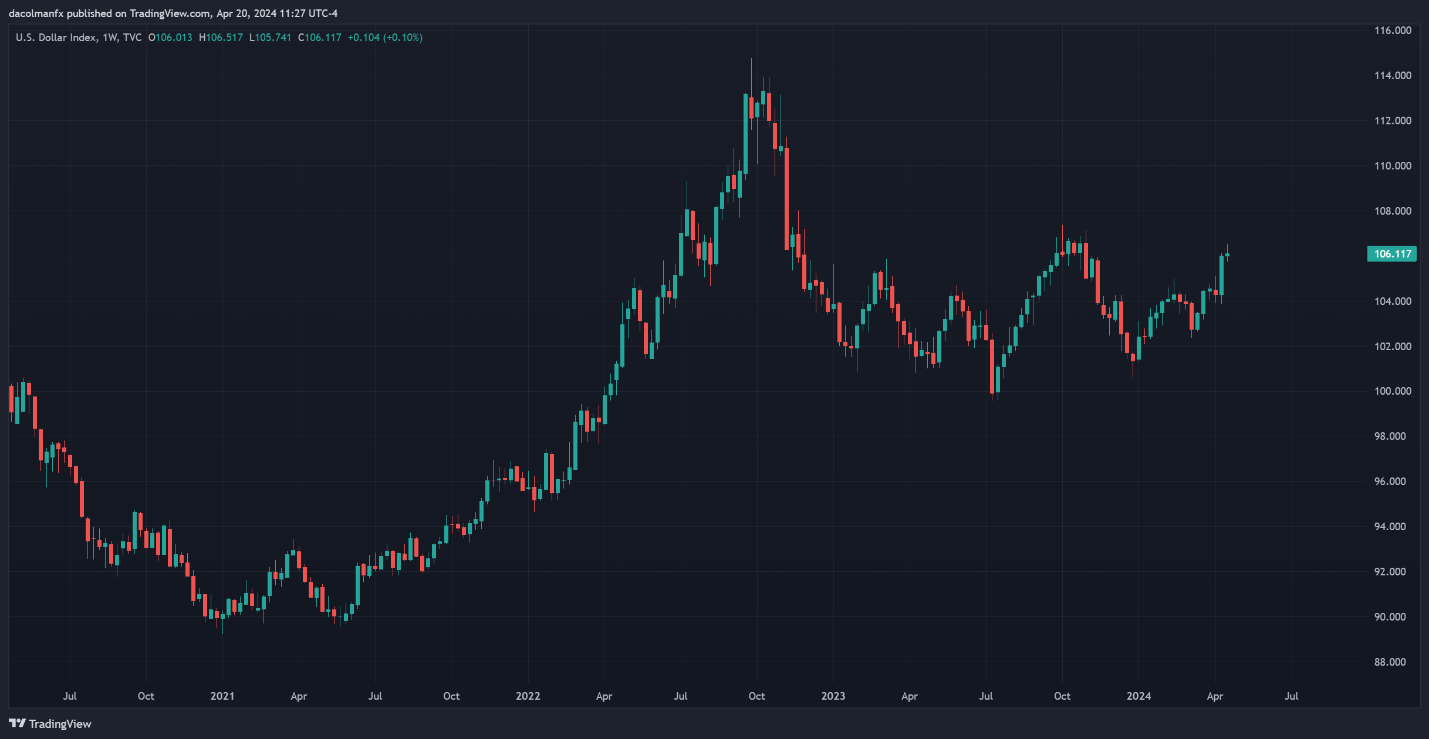
Source: TradingView
Upcoming macro releases could further bolster the greenback’s strength. On the U.S. economic calendar, there are two key reports that could ignite market volatility and shape investor sentiment in the days ahead: first-quarter gross domestic product on Thursday and March core PCE deflator – the Fed’s preferred measure of inflation on Friday.
With last month’s red-hot retail sales, CPI, and PPI readings, there’s a good chance these reports could top consensus estimates. That said, forecasts suggest Q1 GDP grew at an annualize rate of 2.1%, marking a slight deceleration from the robust 3.4% increase seen in the preceding quarter, yet still surpassing potential output, which by definition is inflationary.
Wondering about the U.S. dollar’s technical and fundamental outlook? Gain clarity with our latest forecast. Download a free copy now!
Recommended by Diego Colman
Get Your Free USD Forecast
In terms of core PCE, this metric is seen increasing 0.3% on a seasonally adjusted basis, bringing the 12-month reading to 2.6% from 2.8% previously, a small but positive step in the right direction and a sign that underlying price pressures remain extremely sticky.
UPCOMING US DATA
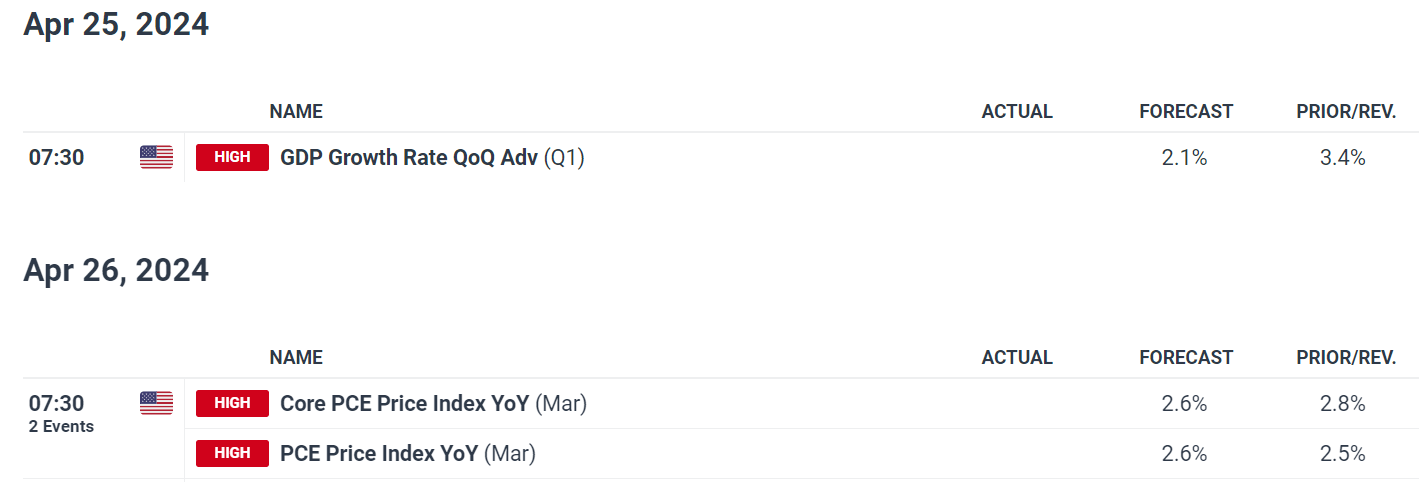
Source: DailyFX Economic Calendar
In the event of an upside surprise in both data points, investors are likely to coalesce around the view that the economy is still running at full steam and that inflation will be harder to control. This scenario should prompt traders to push the Fed’s first rate cut further out and price in a shallower easing cycle. Higher interest rates for longer should keep yields biased upwards, reinforcing the U.S. dollar’s bullish impetus.
All in all, the U.S. dollar’s prospects appear positive for now. The evolving macroeconomic picture clearly favors a scenario where the Federal Reserve will err on the side of caution, delaying its easing cycle to counter stubborn inflation, while counterparts like the ECB and BoE move closer to pivoting to a looser stance. This dynamic supports the dollar’s potential for continued gains.
For an extensive analysis of the euro’s medium-term prospects, download our complimentary Q2 forecast
Recommended by Diego Colman
Get Your Free EUR Forecast
EUR/USD FORECAST – TECHNICAL ANALYSIS
After enduring notable losses last week, EUR/USD steadied and mounted a modest comeback over the past few days, rebounding off the psychological 1.0600 level and pushing past the 1.0650 mark. If the pair continues to recover in the coming days, resistance is expected at 1.0695 and 1.0725 thereafter. On further strength, all eyes will be on 1.0820.
Conversely, should sellers reassert themselves and take charge of the market, technical support becomes apparent at 1.0600. Bulls must vigorously defend this technical floor; any failure to do so could exacerbate bearish momentum in the near term, paving the way for a deeper decline towards the 2023 lows near 1.0450.
EUR/USD PRICE ACTION CHART
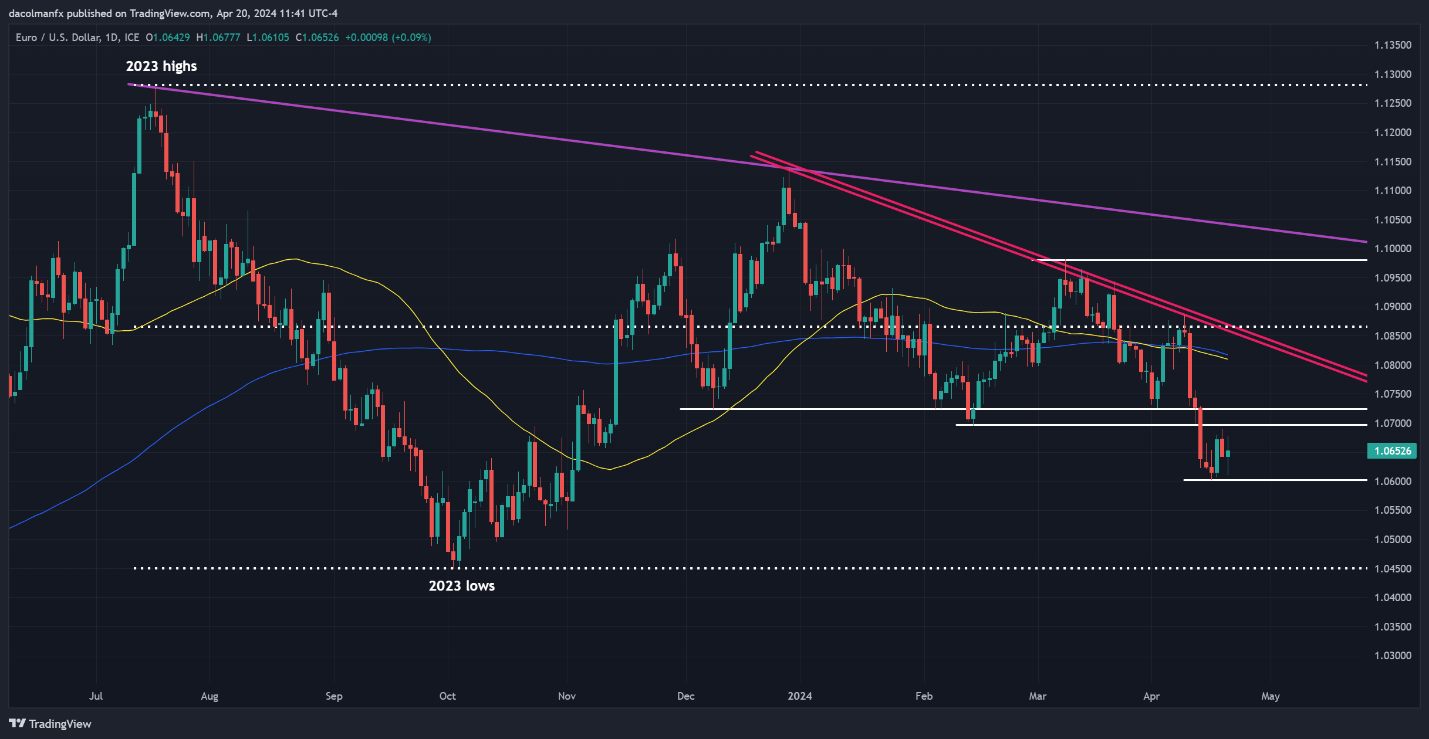
EUR/USD Chart Created Using TradingView
For a complete overview of the Japanese yen’s outlook over the next couple of months, make sure to download our Q2 forecast!
Recommended by Diego Colman
Get Your Free JPY Forecast
USD/JPY FORECAST – TECHNICAL ANALYSIS
Earlier in the week, USD/JPY surged to multi-decade highs around 154.80 before retracing slightly from those lofty levels as the weekend approached. If the downward reversal gains traction in the upcoming trading sessions, support looms at 153.20 and 152.00 thereafter, with 150.80 possibly becoming a focal point if these price thresholds are breached.
On the flip side, if USD/JPY resumes its climb, resistance is likely to materialize near 154.80, followed by 156.00, the upper boundary of a short-term rising channel in place since December of last year. While the pair maintains a bullish outlook, it’s essential to proceed with caution given the overbought market conditions and the increasing probability of FX intervention by the Japanese government.
USD/JPY PRICE ACTION CHART
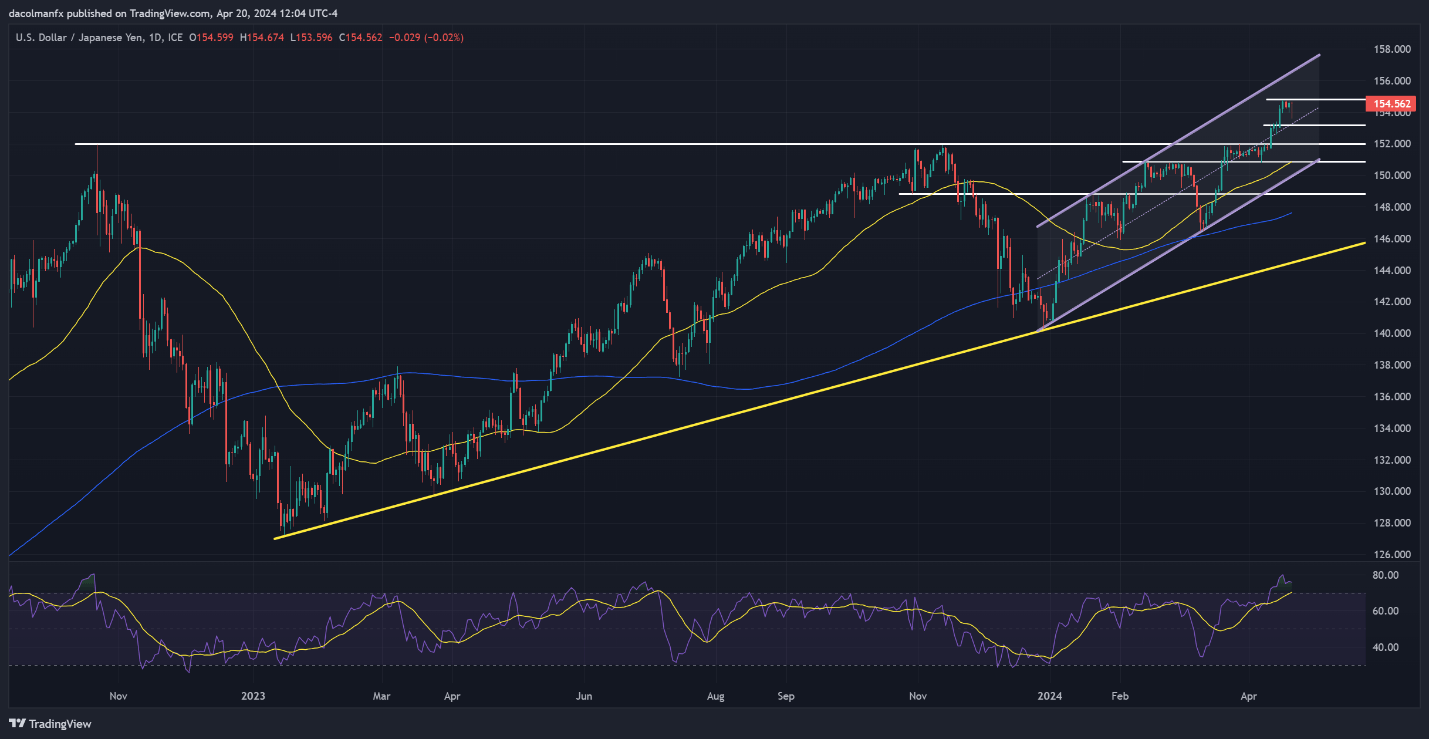
USD/JPY Chart Created Using TradingView
Interested in learning how retail positioning can offer clues about GBP/USD’s near-term trajectory? Our sentiment guide has valuable insights about this topic. Download it now!
| Change in | Longs | Shorts | OI |
| Daily | -2% | -11% | -5% |
| Weekly | 0% | 1% | 1% |
GBP/USD FORECAST – TECHNICAL ANALYSIS
GBP/USD sold off this week, slipping below a technical floor at 1.2430 and hitting its lowest point since November. With bearish momentum prevailing, there’s potential for accelerated losses in the short term, possibly prompting a revisit of 1.2320 – a major Fibonacci support level. Prices may bottom out in this area before reversing higher; but in the case of a breakdown, a move towards 1.2168 could unfold.
Alternatively, if sentiment shifts back in favor of buyers and cable rebounds off its current position, resistance zones can be identified at 1.2430 and 1.2525 subsequently. Upside clearance of these levels could boost upward impetus, creating the right conditions for a rally towards the 200-day simple moving average at 1.2570.
GBP/USD PRICE ACTION CHART
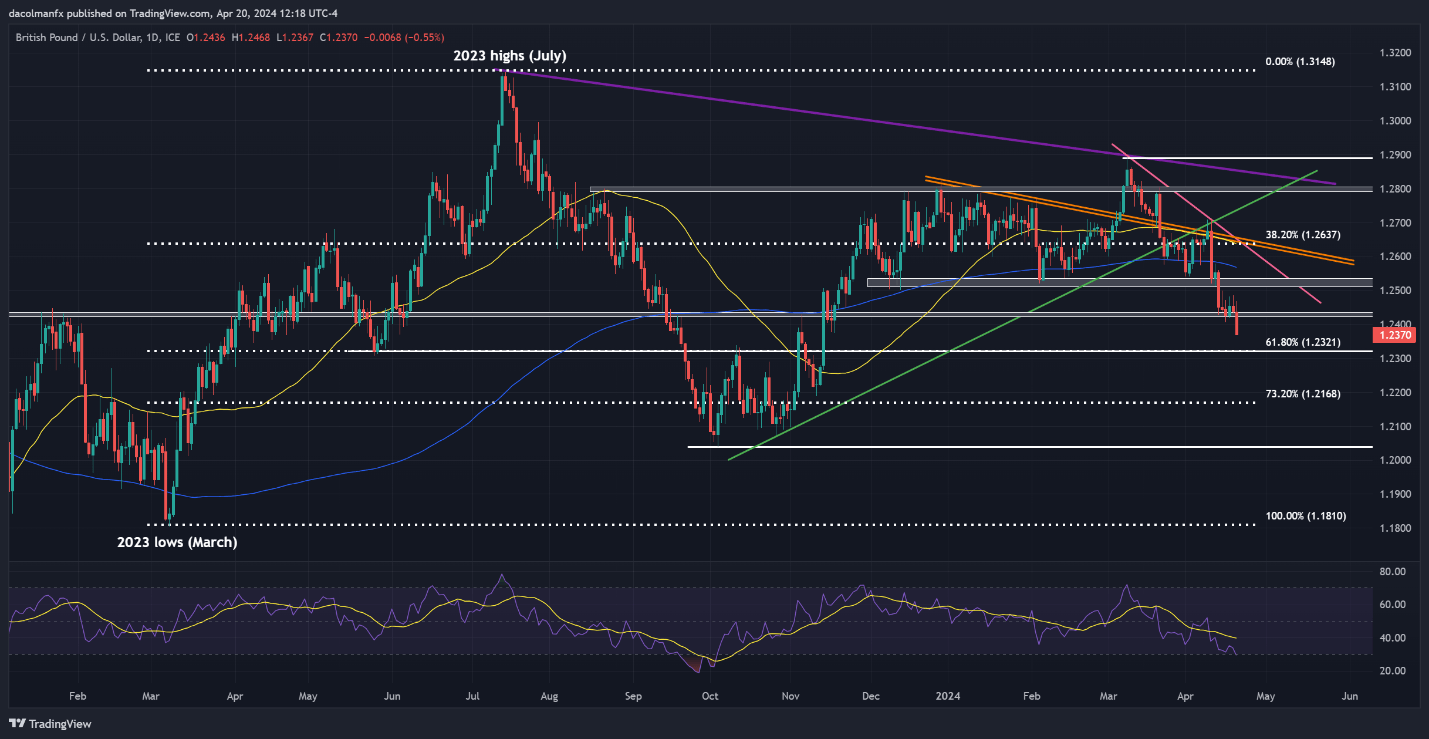
GBP/USD Chart Created Using TradingView