Most Read: US Dollar Outlook Post Fed Decision: EUR/USD & GBP/USD – Technical Analysis
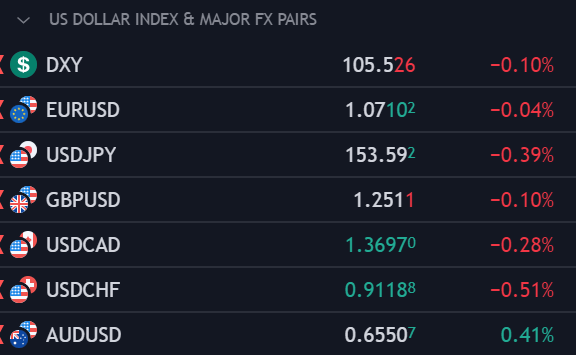
The U.S. dollar (DXY) experienced a slight decline on Thursday, continuing its pullback following the Federal Reserve’s monetary policy decision in the previous session. To recap, the central bank kept borrowing costs unchanged within their current target range of 5.25%-5.50%, in line with expectations, while maintaining an easing bias in its forward guidance.
A noteworthy development was the Fed’s decision to significantly taper the pace of its quantitative tightening program. Beginning in June, the monthly amount of maturing Treasuries allowed to roll off the balance sheet will be cut from $60 billion to a mere $25 billion. This move caught many bond dealers off guard, as most anticipated a smaller reduction.
On the inflation front, policymakers sounded the alarm bells, indicating that there has been a lack of further progress on cooling price pressures in recent months – a hawkish acknowledgment. However, Chair Powell’s subsequent press conference offered a counterbalancing message. While he did signal that the bar to start cutting rates is high, he suggested an even more rigorous standard for resuming hikes.
Want to know where the U.S. dollar may be headed over the coming months? Explore key insights in our second-quarter forecast. Request your free trading guide now!
Recommended by Diego Colman
Get Your Free USD Forecast
With the Fed failing to embrace a hawkish posture decisively, yields may find it difficult to sustain an upward trajectory. This outcome could, in turn, strip the U.S. dollar of a key bullish catalyst, particularly if incoming economic data begins to weaken materially. That said, Friday’s highly anticipated April employment survey is a key event to watch, with economists expecting around 243,000 new jobs.
A weaker-than-expected nonfarm payrolls report could shift the narrative again, prompting traders to start discounting more monetary easing for 2024, creating a hostile environment for the U.S. dollar. On the other hand, hotter-than-forecast job growth might force markets to price in a scenario of higher interest rates for longer – a bullish outcome for the greenback.
UPCOMING NFP REPORT
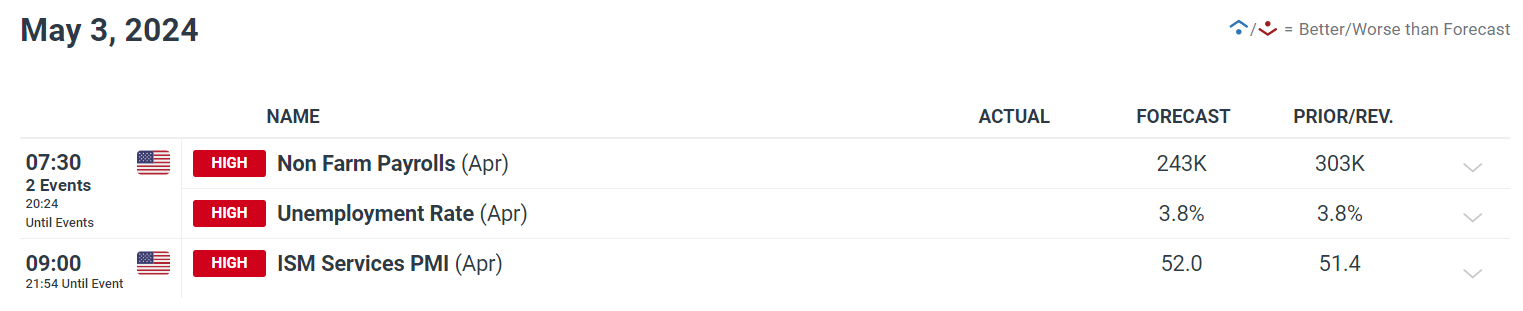
Source: DailyFX Economic Calendar
Wondering about EUR/USD’s medium-term prospects? Gain clarity with our Q2 forecast. Download it now!
Recommended by Diego Colman
Get Your Free EUR Forecast
EUR/USD FORECAST – TECHNICAL ANALYSIS
EUR/USD trended lower on Thursday after an unsuccessful attempt to clear the resistance at 1.0725, with prices moving back towards the 1.0700 handle. Traders should closely monitor this support area in the coming days, as a break below it could trigger a pullback towards 1.0645 and potentially even 1.0600.
In the event of a bullish reversal from current levels, the first technical ceiling worth keeping an eye on in the near term is situated at 1.0725, followed by 1.0755. Further upward momentum will draw attention to the 1.0800 zone, where the 50-day and 200-day simple moving averages currently intersect.
EUR/USD PRICE ACTION CHART
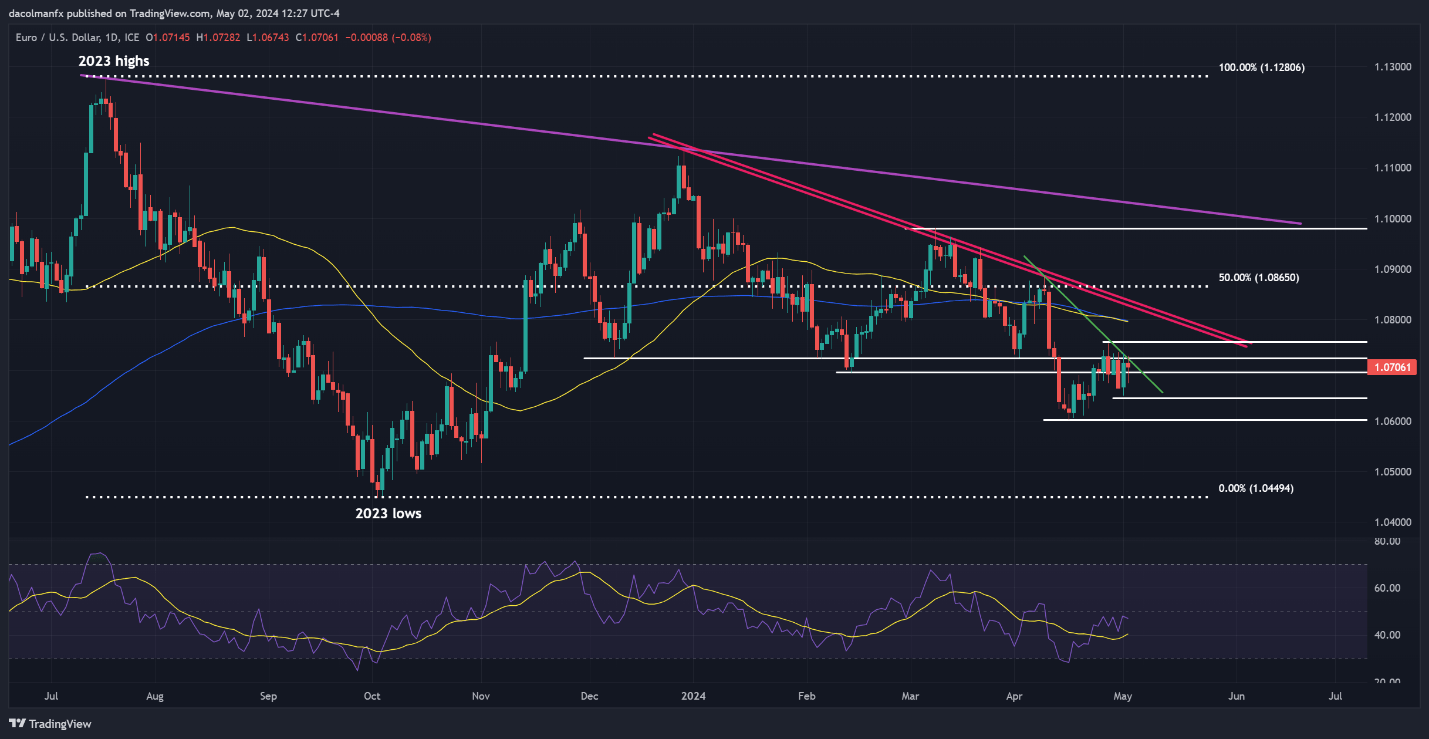
EUR/USD Chart Created Using TradingView
For a complete overview of the British pound’s technical and fundamental outlook, make sure to download our complimentary Q2 trading forecast now!
Recommended by Diego Colman
Get Your Free GBP Forecast
GBP/USD FORECAST – TECHNICAL ANALYSIS
GBP/USD also edged down on Thursday, but managed to stabilize around the 1.2515/1.2500 range. Bulls must strive to maintain prices above this support region to prevent sentiment towards the pound from deteriorating; otherwise, sellers could seize the opportunity to launch a bearish assault on 1.2430.
On the other hand, if buyers make a new appearance and propel prices higher, resistance emerges at 1.2550, where the 200-day simple moving average converges with a short-term descending trendline. Moving further up, attention will be focused on Fibonacci resistance at 1.2590, followed by 1.2620.
GBP/USD PRICE ACTION CHART
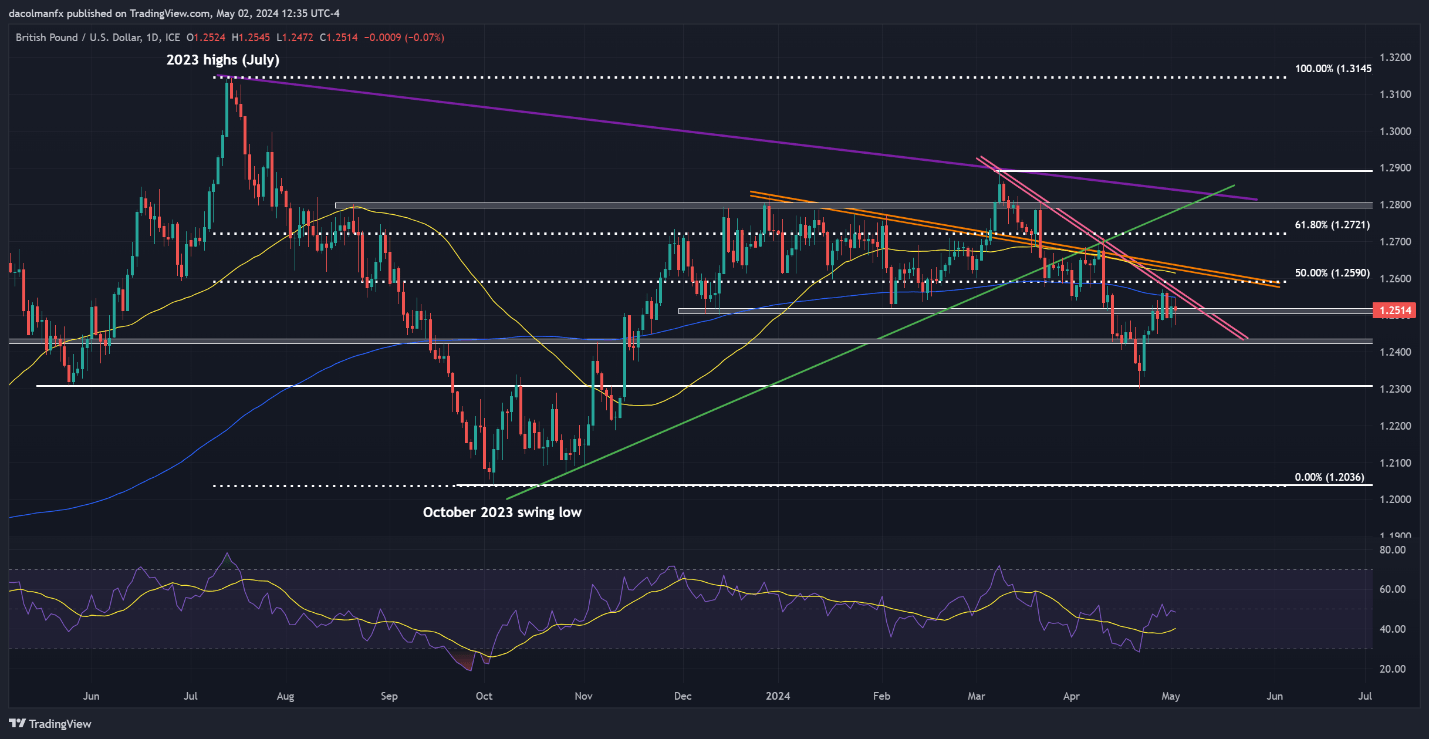
GBP/USD Chart Created Using TradingView