GOLD PRICE OUTLOOK:
- Gold prices fell 1.55% this week, briefly touching their lowest level since early April
- The current downward correction shows potential for further extension despite positive fundamentals
- This article explores XAU/USD’s technical outlook for the coming days and weeks
Most Read: British Pound Weekly Forecast – BoE Policy Call Tops The Bill
Gold (XAU/USD) dropped for the second straight week, with prices settling just above the $2,300 threshold heading into the weekend. This occurred against a backdrop of relatively moderate volatility following key market developments, notably the Federal Reserve’s monetary policy announcement midweek and the release of the U.S. employment report on Friday.
Bullion’s retreat caught many traders off guard, as they had anticipated a stronger response amidst falling U.S. bond yields, which fell sharply after Fed Chair Powell dismissed the idea of resuming rate hikes and indicated the next move is still likely to be a cut, despite renewed inflation worries. This dovish stance injected a sense of optimism into the market, boosting risk assets at the expense of defensive plays.
Even the U.S. jobs report, arriving weaker than anticipated and emboldening FOMC easing wagers, failed to prop up the precious metal. While traders may find the market’s reaction perplexing, it’s important to acknowledge that the frequently dominant inverse relationship between gold and rates significantly weakened earlier this year, with both going up at the same time.
For an extensive analysis of gold’s fundamental and technical outlook, download our complimentary quarterly trading forecast now!
Recommended by Diego Colman
Get Your Free Gold Forecast
Looking ahead, mounting signals of economic vulnerability, the Fed’s plans to start easing, and the emerging downtrend in the U.S. dollar, should be bullish for precious metals, at least in theory. However, given the significant rally already seen in the space this year and its detachment from fundamentals, it would not be surprising to see gold continue to deflate or trade sideways, bucking tailwinds.
In terms of upcoming catalysts, the U.S. economic calendar lacks major high-profile events and looks relatively quiet in the week ahead, implying that volatility is unlikely to surge and may stay contained for now. However, this picture could change later this month with the release of the April consumer price index, scheduled for May 15. Any surprises in the data could again alter sentiment and trigger sharp price swings.
Interested in learning how retail positioning can shape the short-term trajectory of gold prices? Our sentiment guide has the information you need—download it now!
| Change in | Longs | Shorts | OI |
| Daily | -6% | -5% | -6% |
| Weekly | -2% | -9% | -5% |
GOLD PRICE TECHNICAL ANALYSIS
After a poor performance this week, gold (XAU/USD) briefly hit its lowest mark in nearly a month, yet succeeded in maintaining its position above support at $2,280. Bulls will need to protect this floor fiercely; a lapse in defense could trigger a descent toward a key Fibonacci level at $2,260. Continued losses from this juncture would bring the 50-day simple moving average at $2,235 into play.
In the event of a bullish turnaround from present levels, the first technical hurdle to watch closely can be identified at $2,325, followed by $2,355. Although reclaiming this territory might pose some difficulty for buyers, a decisive breakout could pave the way for a rally towards $2,375 – a short-term descending trendline originating from the record high.
GOLD PRICE TECHNICAL CHART
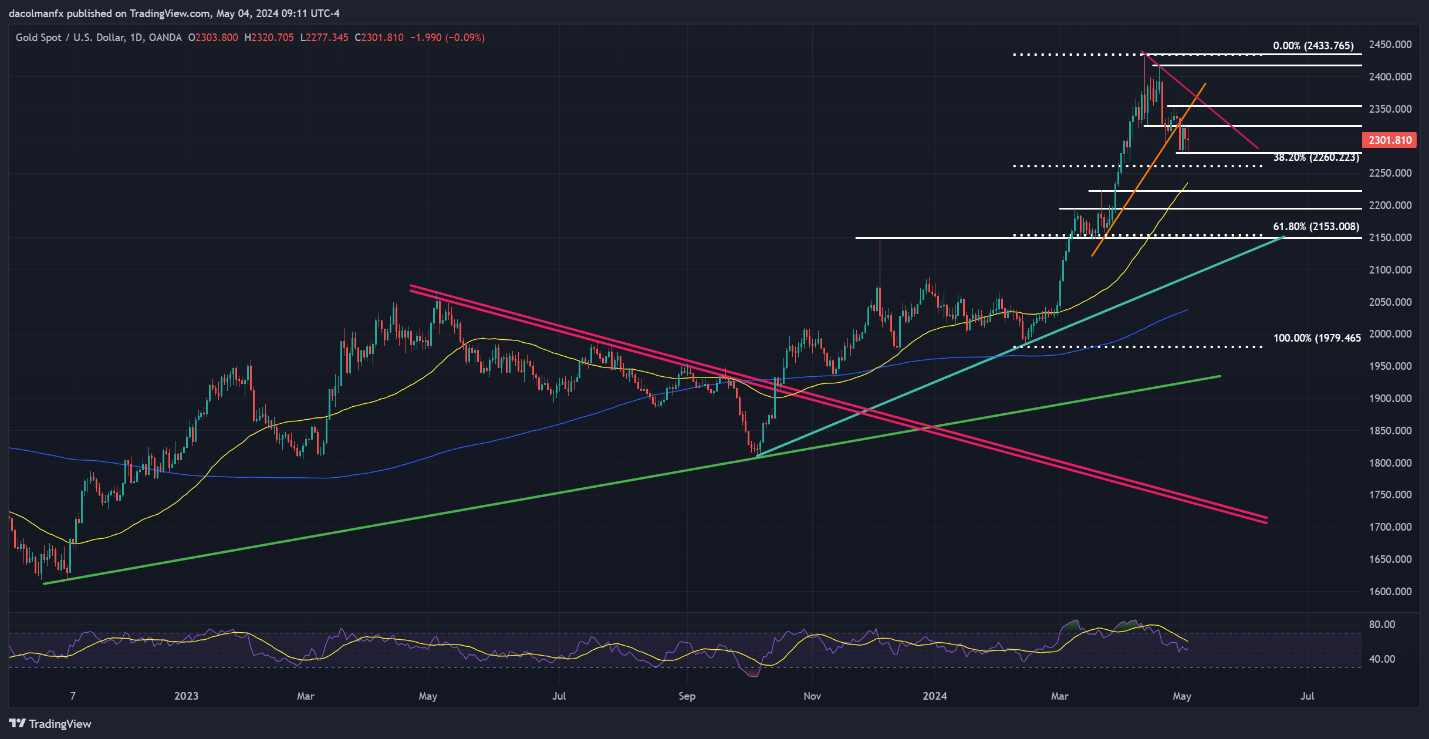
Gold Price Chart Created Using TradingView