Most Read: Markets Week Ahead – Markets Risk-On, BoE Decision, Gold, Nasdaq, Bitcoin
The U.S. dollar, as measured by the DXY index, was a tad softer on Monday in a context of mixed U.S. Treasury yields and thinner liquidity in the FX space, with UK markets closed for a bank holiday. Despite this, the dollar’s decline wasn’t uniform – it weakened against major currencies like the euro and the pound but strengthened against the yen.
FX MARKET PERFORMANCE
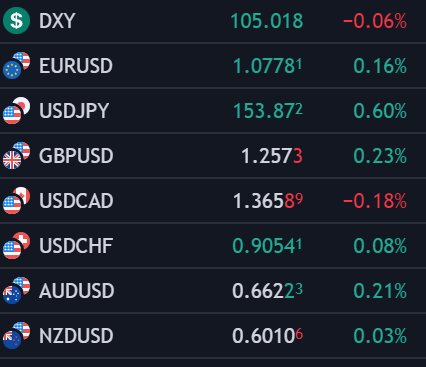
Source: TradingView
Eager to gain insights into the U.S. dollar’s path? Discover the answers in our complimentary quarterly trading guide. Request a copy now!
Recommended by Diego Colman
Get Your Free USD Forecast
Taking Monday’s fluctuations into consideration, the DXY index is down more than 1.4% from its April highs, although it has rebounded slightly from its recent trough established last Friday. Nevertheless, bulls have been clearly on the defensive over the past few trading sessions, notably following the Federal Reserve’s dovish tone at its last gathering and disappointing U.S. employment data.
The Fed’s intention to ease despite renewed inflation concerns, which was the takeaway from last week’s FOMC meeting, coupled with weaker-than-anticipated job creation/cooling wage pressures in April, has triggered a sharp pullback in bond yields in May, emboldening new rate cut bets for the year after they were sharply reduced late last month. These developments have evolved into a significant headwind for the U.S. currency.
Gazing ahead, the U.S. economic calendar lacks high-impact events that could spark major bouts of volatility in the upcoming days. This could allow current forex trends to consolidate for some time without wild price swings. However, the near-term outlook would need to be revised around mid-May, when the next set of U.S. CPI figures is due. This report will offer fresh insights into the current inflationary landscape, crucial for informing the Fed’s future decisions and timeline to start slashing borrowing costs.
For a complete overview of the EUR/USD’s technical and fundamental outlook for the coming months, make sure to download our complimentary Q2 forecast!
Recommended by Diego Colman
Get Your Free EUR Forecast
EUR/USD FORECAST – TECHNICAL ANALYSIS
EUR/USD moved up on Monday and made its way towards the 1.0800 handle, coming within striking distance from taking out both its 50-day and 200-day simple moving averages. Bears must ensure that prices remain under these technical indicators to stall the bullish momentum; any lapse might trigger a rally towards trendline resistance at 1.0830, followed by 1.0865, a key Fibonacci barrier.
In the event of a bearish turnaround from current levels, traders should closely watch 1.0750 and 1.0725 as critical support areas. Below these thresholds, the focus will shift to 1.0695, followed by 1.0645. A retest of the latter zone could see the pair stabilize before mounting a comeback again. However, if a breakdown occurs, the possibility of a decline towards the 1.0600 mark cannot be ruled out.
EUR/USD PRICE ACTION CHART
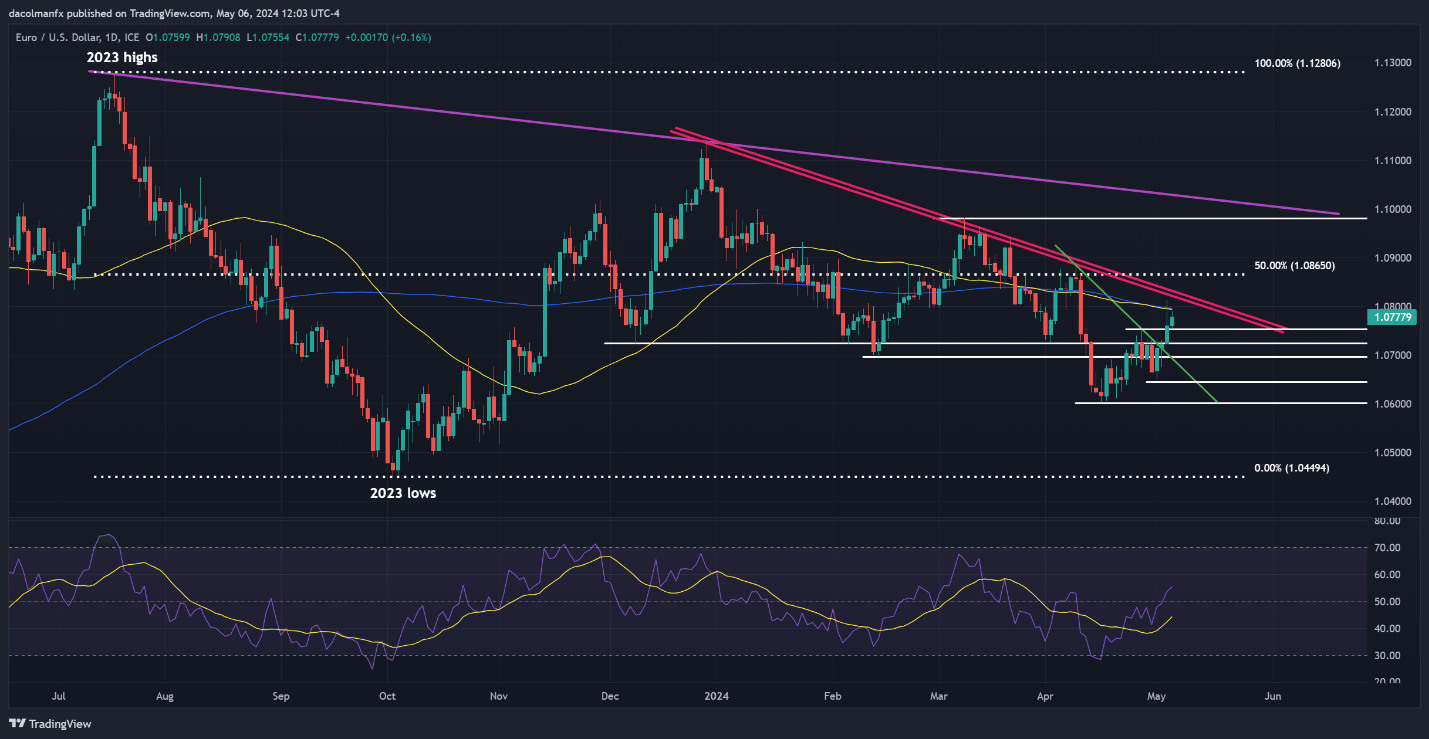
EUR/USD Chart Created Using TradingView
Wondering about GBP/USD’s medium-term prospects? Gain clarity with our latest forecast. Download it now!
Recommended by Diego Colman
Get Your Free GBP Forecast
GBP/USD FORECAST – TECHNICAL ANALYSIS
GBP/USD also advanced on Monday, recapturing its 200-day simple moving average and steadily approaching confluence resistance between 1.0610 and 1.0630 – an area that marks a convergence of the 50-day SMA with two significant trendlines. Buyers may find it challenging to breach this technical hurdle; however, a bullish breakout could spur a move towards 1.2720.
Alternatively, if the bears rouse from their slumber and steer prices beneath the 200-day SMA, support extends from 1.2515 to 1.2500. Cable needs to hold above this floor to prevent selling pressure from intensifying; failure to do so could create the right conditions for a plunge towards 1.2430. On further weakness, all eyes will be on the psychological 1.2300 level.
GBP/USD PRICE ACTION CHART

GBP/USD Chart Created Using TradingView