Most Read: Market Sentiment Analysis and Outlook: Crude Oil, Dow 30, AUD/USD
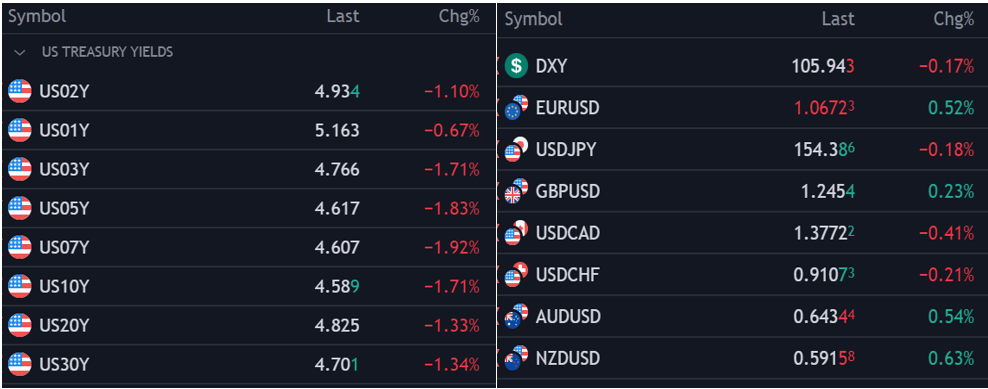
The US dollar, as measured by the DXY index, retreated from multi-month highs on Wednesday, dragged lower by a pullback in Treasury yields. Despite this retracement, the DXY remains biased to the upside, especially after top Fed officials signaled that the U.S. central bank may delay the start of its easing cycle in response to resilient economic data and hotter-than-expected inflation readings in recent months.
Putting fundamental analysis aside, the next segment of this article will focus on analyzing the technical outlook for four U.S. dollar FX pairs: EUR/USD, USD/JPY, GBP/USD, and USD/CAD. Within this section, we will examine price action dynamics and essential tech levels poised to function as either support or resistance in the upcoming trading sessions.
Wondering about EUR/USD’s medium-term prospects? Gain clarity with our Q2 forecast. Download it now!
Recommended by Diego Colman
Get Your Free EUR Forecast
EUR/USD FORECAST – TECHNICAL ANALYSIS
After steep losses in recent days, EUR/USD stabilized and rebounded off the psychological 1.0600 level on Wednesday, pushing past the 1.0650 mark. If the pair manages to build upon its recovery in the days ahead, resistance lies at 1.0695, followed by 1.0725. On further strength, the focus will be on 1.0820.
On the other hand, if sellers return and regain control of the market, technical support emerges at 1.0600. Bulls must staunchly defend this technical floor; a failure to do so could reinforce bearish pressure in the near term, resulting in a deeper pullback toward the 2023 lows located near 1.0450.
EUR/USD PRICE ACTION CHART
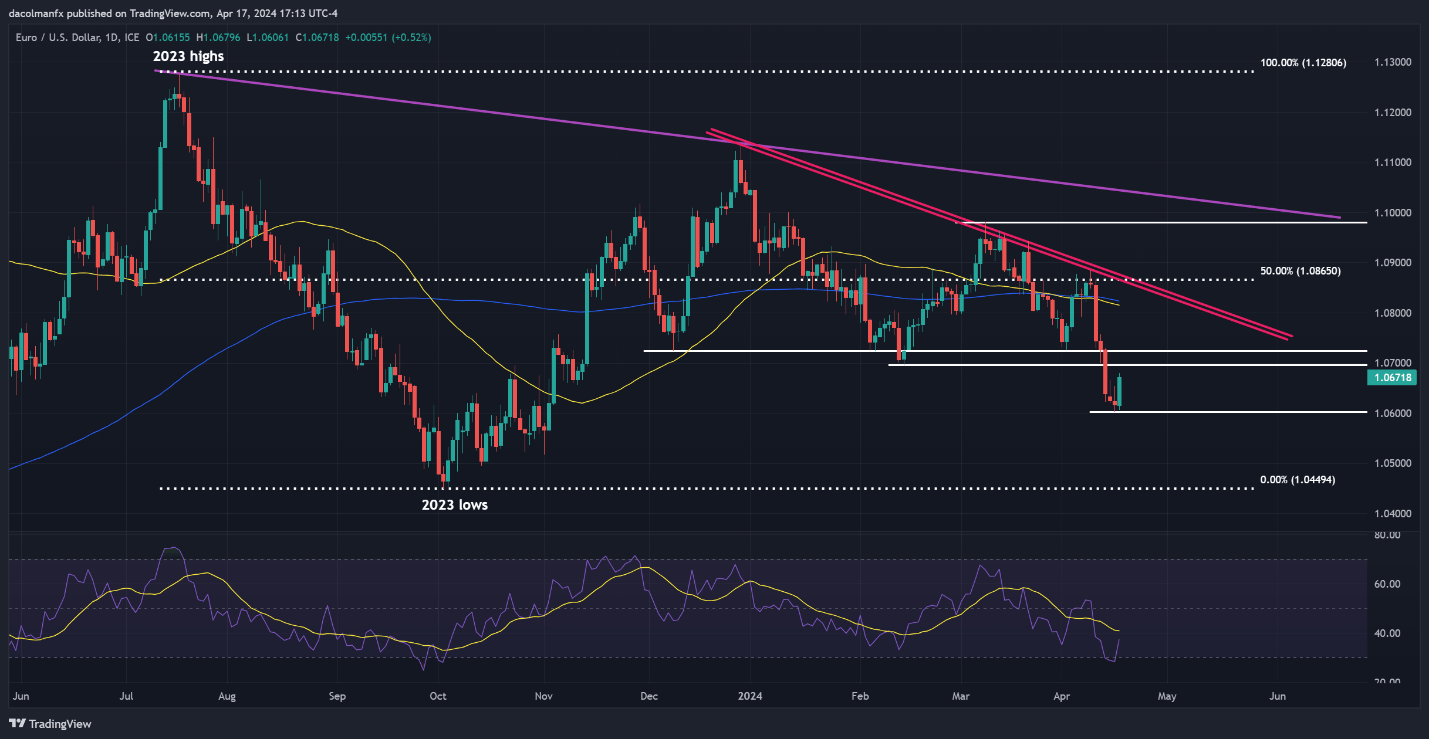
EUR/USD Chart Created Using TradingView
Wondering about the yen‘s outlook – will it continue to weaken or mount a bullish comeback? Discover all the details in our Q2 forecast. Don’t miss out – request your complimentary guide today!
Recommended by Diego Colman
Get Your Free JPY Forecast
USD/JPY FORECAST – TECHNICAL ANALYSIS
USD/JPY edged lower on Wednesday, stepping off its multi-decade high established in the previous session when the pair hit 154.78. Should the downturn reversal gain momentum later this week, support can be spotted at 153.20 and 152.00 thereafter. Below these levels, 150.80 may become a focal point.
Conversely, if USD/JPY resumes its rally, resistance looms at 154.78, followed by 156.00, the upper limit of a short-term ascending channel. Despite the pair’s bullish bias, caution is warranted due to overbought market conditions and the growing possibility of FX intervention by the Japanese government.
USD/JPY PRICE ACTION CHART
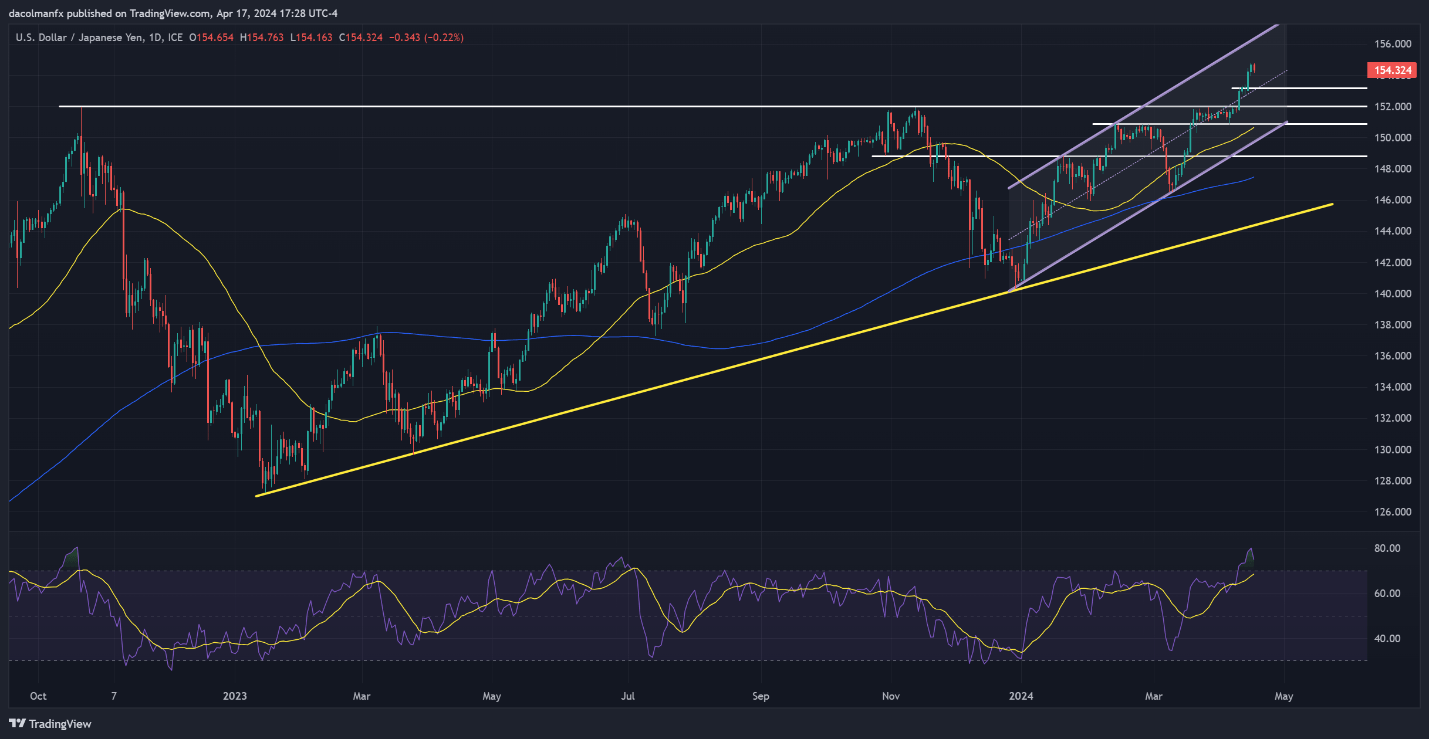
USD/JPY Chart Created Using TradingView
For a complete overview of the British pound’s technical and fundamental outlook, make sure to download our complimentary Q2 trading forecast now!
Recommended by Diego Colman
Get Your Free GBP Forecast
GBP/USD FORECAST – TECHNICAL ANALYSIS
GBP/USD mounted a moderate comeback on Wednesday, bouncing off support in the 1.2430 region. If the pair extends its rebound in the coming trading days, resistance awaits at 1.2525, followed by 1.2575 near the 200-day simple moving average. On continued strength, the next key level to watch is 1.2645.
Alternatively, if sellers return and trigger a market selloff, support is visible at 1.2430. To prevent a larger drop, bulls must protect this floor tooth and nail; any lapse could usher in a slump towards 1.2325. Further losses beyond this point might refocus attention on the October 2023 lows near 1.2040.
GBP/USD PRICE ACTION CHART
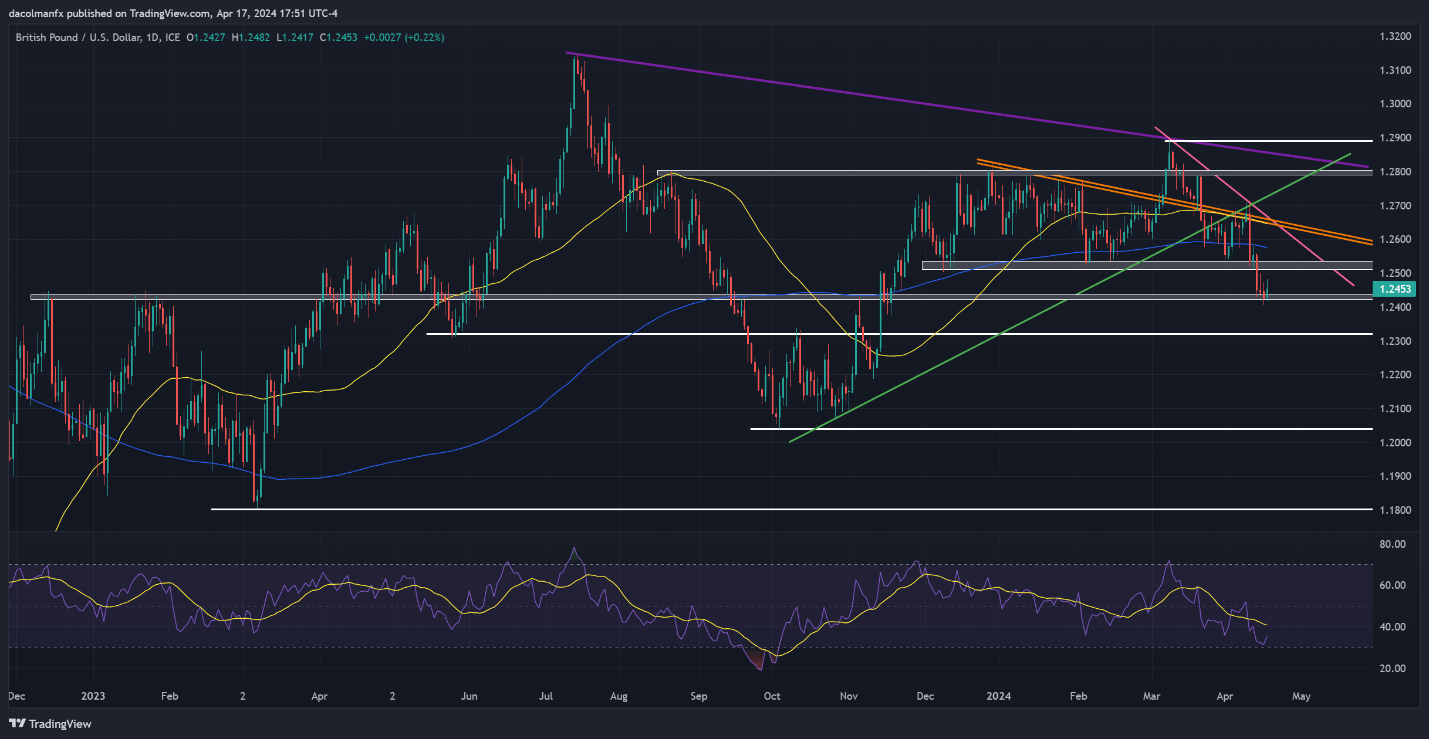
GBP/USD Chart Created Using TradingView
Curious to uncover the connection between FX retail positioning and USD/CAD’s price action dynamics? Check out our sentiment guide for key findings. Download it now!
| Change in | Longs | Shorts | OI |
| Daily | 9% | 4% | 5% |
| Weekly | 10% | 24% | 20% |
USD/CAD FORECAST – TECHNICAL ANALYSIS
After failing to clear confluence resistance at 1.3850, USD/CAD turned lower on Wednesday, with sellers capitalizing on the reversal opportunity and driving prices back down towards 1.3765. If losses pick up pace over the coming trading sessions, support appears near the 1.3700 handle, followed by 1.3610.
Alternatively, if the bulls regain the upper hand and manage to push the exchange rate higher, primary resistance rests at 1.3850, followed by the psychological 1.3900 threshold. Further up the ladder, attention will be fixed on the 2022 highs around 1.3980.
USD/CAD PRICE ACTION CHART
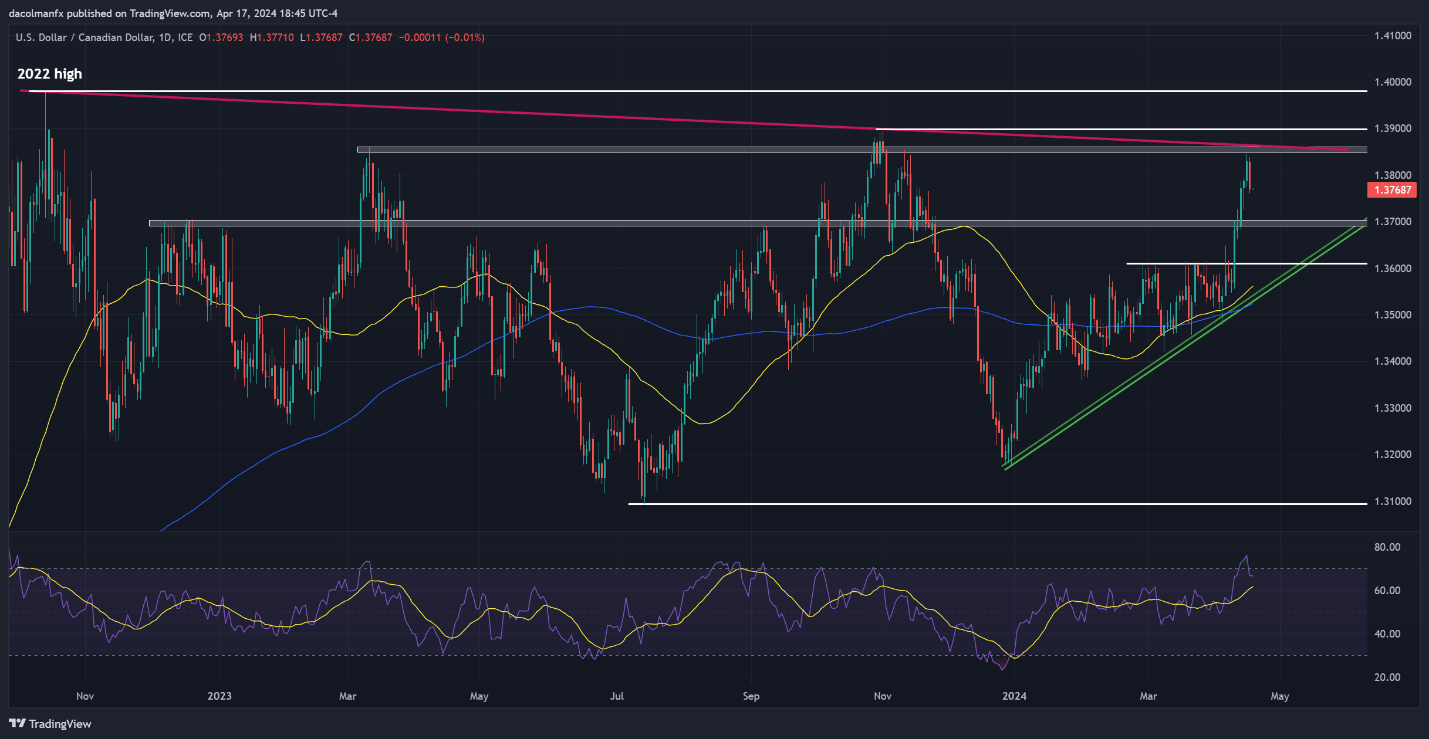
USD/CAD Chart Created Using TradingView