Most Read: Market Outlook & Sentiment Analysis: Silver, NZD/USD, EUR/CHF
The U.S. dollar (DXY) gained on Tuesday on soaring U.S. Treasury yields, with the 2-year note coming within striking distance from overtaking the psychological 5.00% level. Fed Chairman Powell reinforced the current market dynamics by admitting at a forum in Washington that progress on disinflation has slowed and that firmer price pressures have introduced new uncertainty about the timing of rate cuts.
Powell’s comments indicate that policymakers will need more time and better data to gain greater confidence in the inflation outlook before dialing back on policy restraint. The fact that borrowing costs are going to remain higher for longer should be bullish for the U.S. dollar, especially as other key central banks, such as the ECB and the Bank of England, begin to move closer to easing their stance.
Setting aside fundamental analysis, the next section of this article will center on examining the technical outlook for three U.S. dollar FX pairs: EUR/USD, USD/JPY and GBP/USD. Here, we’ll dissect critical price thresholds that can act as support or resistance later this week – levels crucial for effective risk management and strategic positioning.
Stay ahead of the curve and improve your trading prowess! Download the EUR/USD forecast for a thorough overview of the pair’s technical and fundamental outlook.
Recommended by Diego Colman
Get Your Free EUR Forecast
EUR/USD FORECAST – TECHNICAL ANALYSIS
EUR/USD continued to lose ground on Tuesday, confirming Monday’s bearish breakdown (1.0635) and signaling potential for further weakness. The lack of visible support areas around current levels increases the likelihood of a slide towards the 2023 low near 1.0450.
Conversely, should EUR/USD mount a comeback and reclaim the 1.0635 threshold, resistance is anticipated at 1.0700. Further gains here on out could direct attention to 1.0725. Bears must steadfastly protect this technical ceiling; any breach might trigger a rally towards the 50-day and 200-day simple moving averages, situated close to 1.0820.
EUR/USD PRICE ACTION CHART
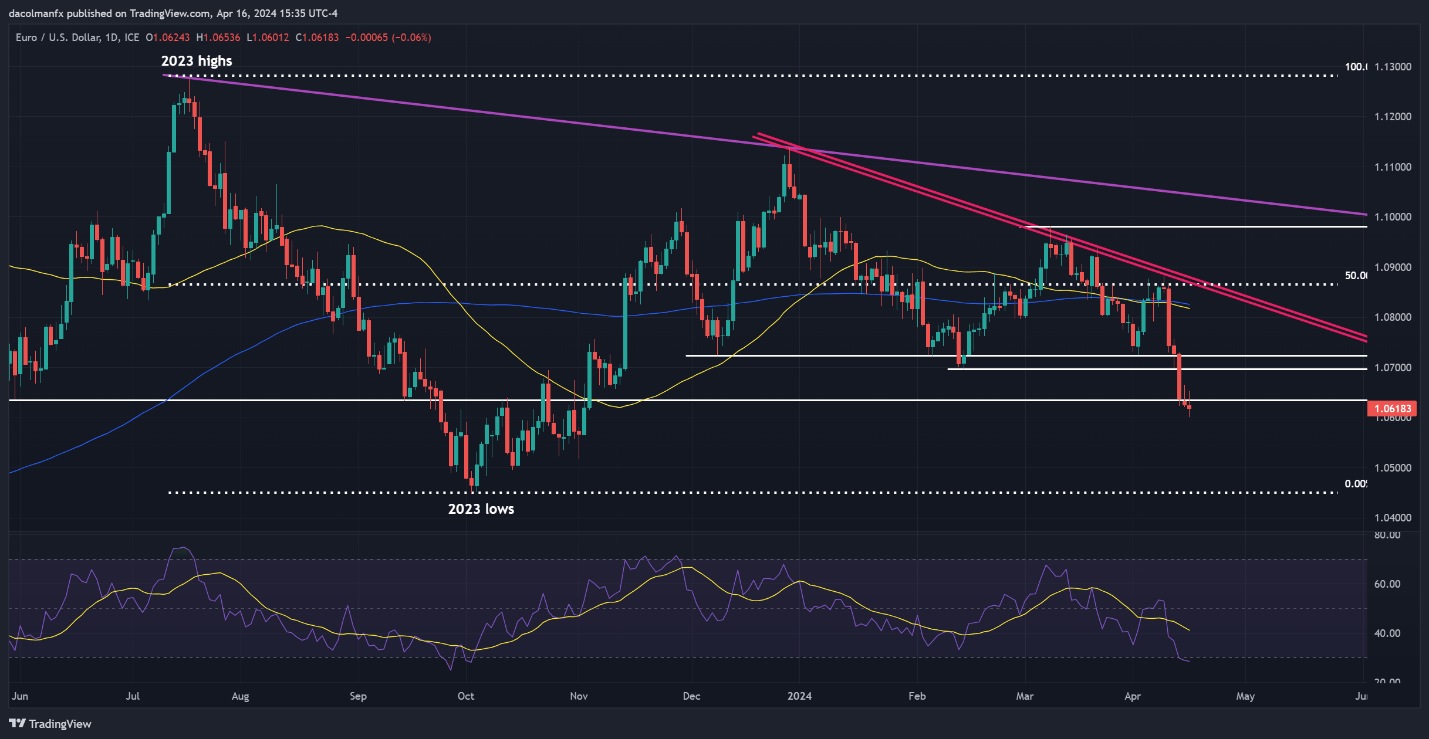
EUR/USD Chart Created Using TradingView
Interested in learning how retail positioning can shape USD/JPY’s trajectory? Our sentiment guide explains the role of crowd mentality in FX market dynamics. Get the free guide now!
| Change in | Longs | Shorts | OI |
| Daily | -5% | 3% | 1% |
| Weekly | 4% | -5% | -4% |
USD/JPY FORECAST – TECHNICAL ANALYSIS
USD/JPY extended its advance on Tuesday, consolidating above 154.50 and hitting its highest point since June 1990. With buyers at the steering wheel, a potential move towards channel resistance at 155.80 may be on the horizon; however, caution is warranted given overbought market conditions and the growing possibility of FX intervention by the Japanese government.
On the flip side, should buying pressure diminish and prices turn lower, initial support looms at 153.20. On further weakness, the focus will be on the 152.00 handle. The pair is likely to stabilize around this level during a pullback, but in the event of a breakdown, we can’t rule out a quick descent towards 150.80, followed by 150.50.
USD/JPY PRICE ACTION CHART
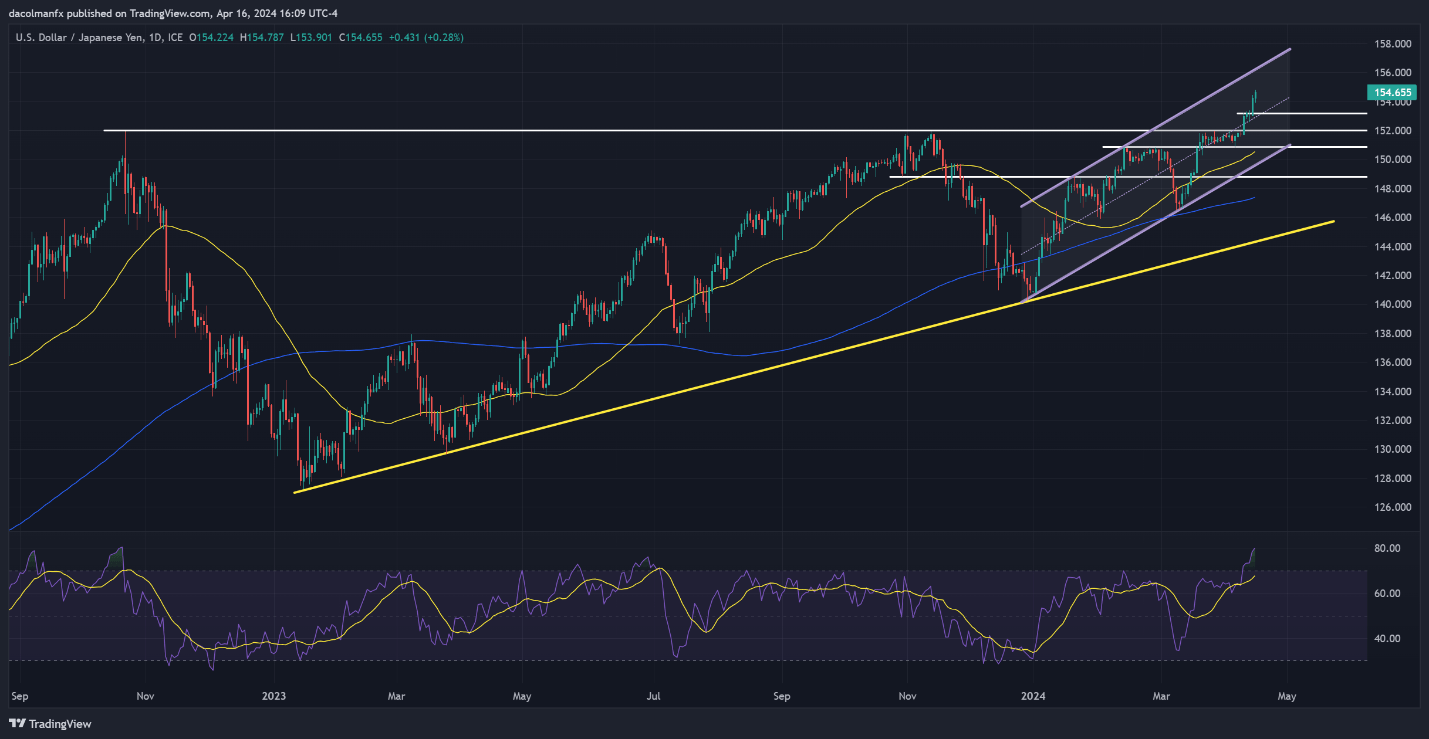
USD/JPY Chart Created Using TradingView
Fine-tune your trading skills and stay proactive in your approach. Request the GBP/USD forecast for an in-depth analysis of the pound’s Q2 outlook.
Recommended by Diego Colman
Get Your Free GBP Forecast
GBP/USD FORECAST – TECHNICAL ANALYSIS
GBP/USD weakened modestly on Tuesday but remained above support at 1.2430. To prevent a deeper retracement, bulls must defend this floor tooth and nail; any lapse could usher in a move towards 1.2325. Further losses beyond this threshold might set the stage for a drop toward the October 2023 lows near 1.2040.
On the other hand, if sentiment turns bullish again and GBP/USD initiates a reversal, key resistance awaits at 1.2525. Beyond this level, focus shifts to the 200-day simple moving average at 1.2580, then to 1.2650, where the 50-day simple moving average intersects with two important short-term trendlines.
GBP/USD PRICE ACTION CHART
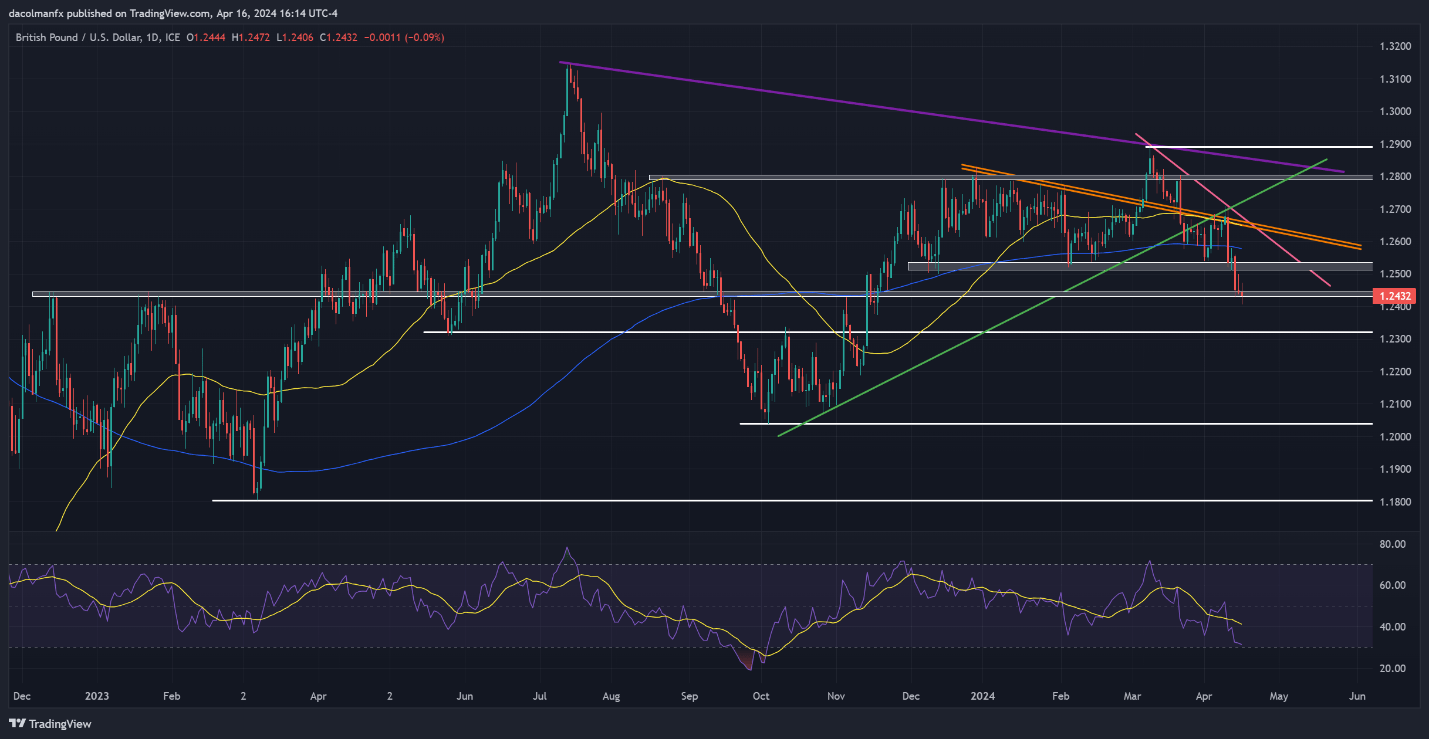
GBP/USD Chart Created Using TradingView