HANG SENG, CSI 300, HSI – Outlook:
- Hang Seng Index’s rebound ran out of steam toward the end of last week.
- China data released last week showed the economy is yet to witness a solid recovery.
- What is the outlook and what are the key levels to watch in the Hang Seng Index and the CSI 300 index?
-Looking for actionable trading ideas? Download our top trading opportunities guide packed with insightful tips for the fourth quarter!
Recommended by Manish Jaradi
Get Your Free Top Trading Opportunities Forecast
The Hang Seng Index’s rebound early last week ran out of steam toward the end of the week, suggesting that a meaningful upward momentum is lacking in Hong Kong/China equities despite the support/stimulus measures in recent months.
Economic data in recent weeks have raised hopes that economic growth in China could be bottoming – the Economic Surprise Index has shown steady improvement since July. However, those hopes were dented after data last weeks showed persistent anemic domestic demand and deflation. Consensus economic growth for the current year is yet to turn around after being downgraded since Q2-2023. For more discussion see, “Q4 Trade Opportunity: HK/China Equities Could be Due for a Rebound,” published October 9.
Chinese policymakers have responded with a string of support/stimulus measures in recent months in an attempt to revive the faltering post-Covid recovery and a weak property sector. Most recently, media reports suggest China is considering creating a state-backed stabilization fund to shore up confidence in equity markets. Moreover, the world’s second-largest economy is considering raising its budget deficit for 2023 as the government prepares a fresh round of stimulus to boost the economy.
Hang Seng Index Monthly Chart
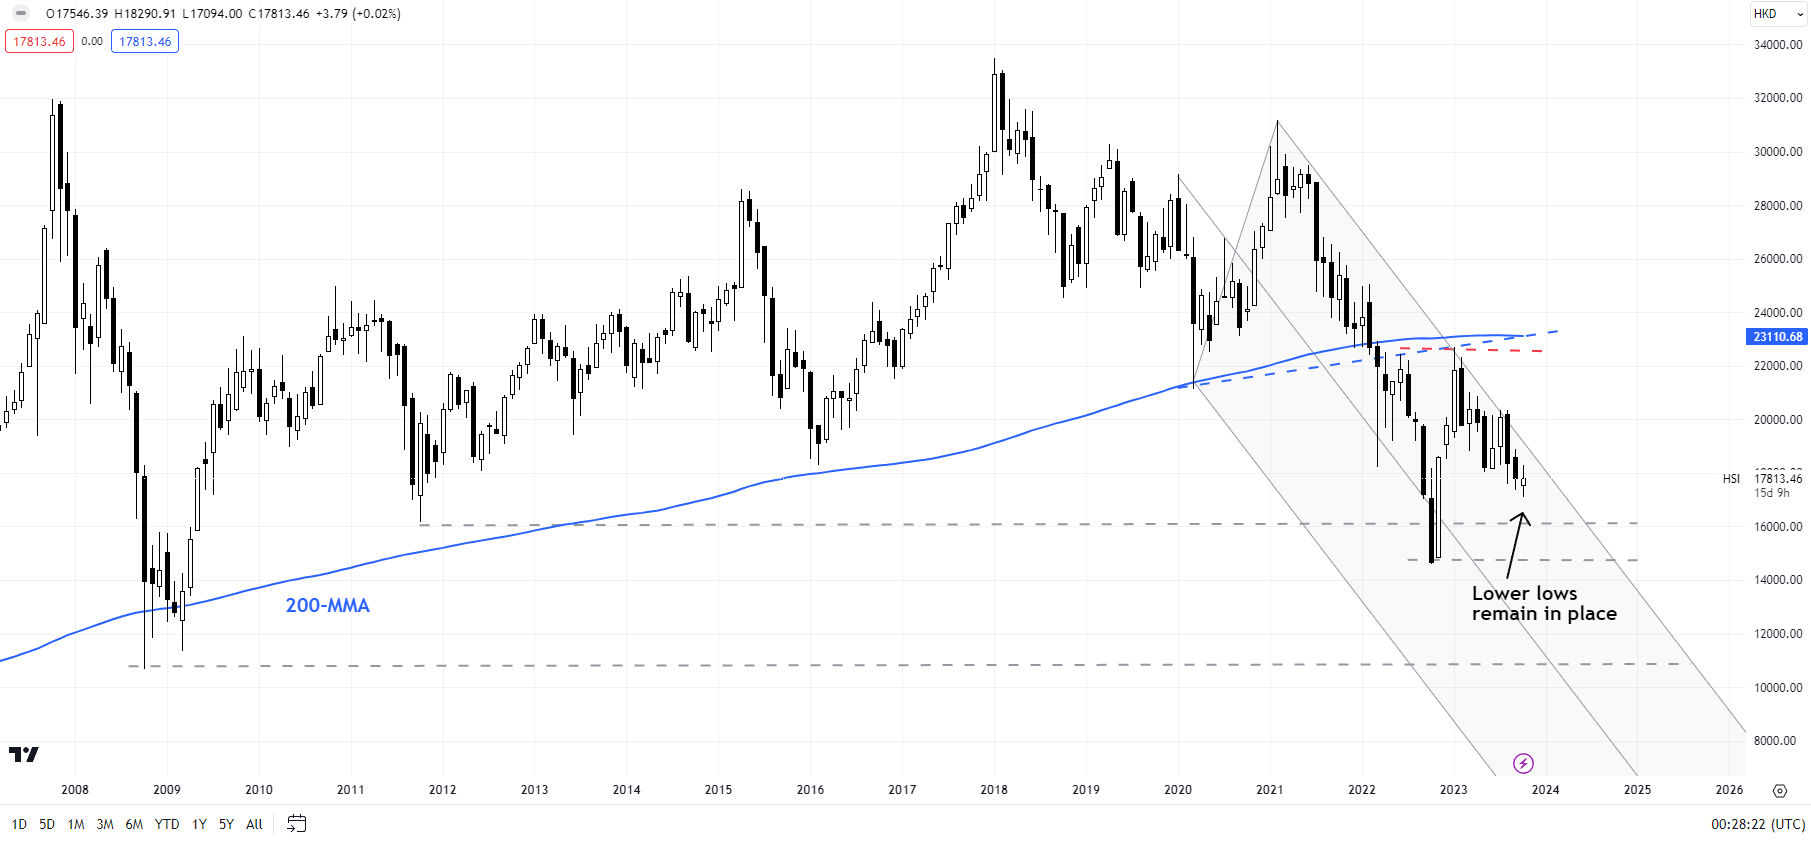
Chart Created by Manish Jaradi Using TradingView
Hang Seng: In search of upward momentum
On technical charts, the Hang Seng Index has rebounded in recent sessions, but it is too early to say if this time is different compared to the rebounds since Q2-2023. At a minimum, the index needs to cross through a vital ceiling at the September high of 18900, coinciding with the 89-day moving average and the upper edge of the Ichimoku cloud on the daily charts.
Hang Seng Index Daily Chart
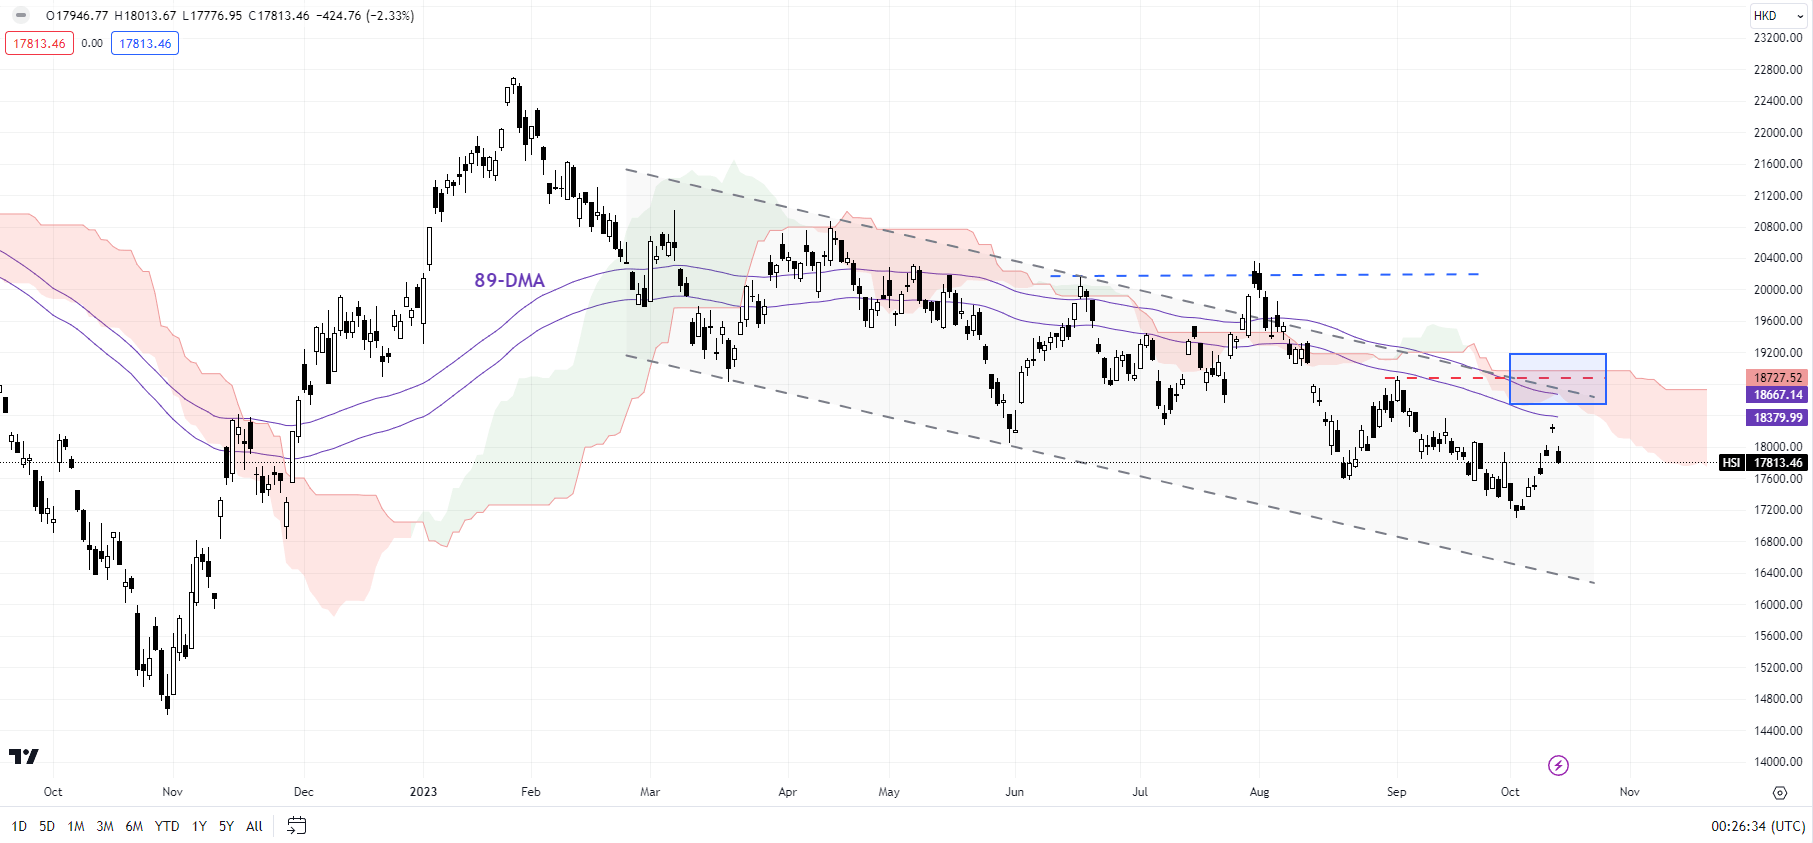
Chart Created by Manish Jaradi Using TradingView
Such a break would reduce the immediate downside risks, and clear the way toward the June-July highs of around 20300. For a reversal of the broader downtrend, it is important for the index to stop making new lows and break above 20300. Until then, risks remain toward the downside, initially toward the early-October low of 17000, followed by the lower edge of a declining channel since early 20300.
CSI 300 Index Weekly Chart
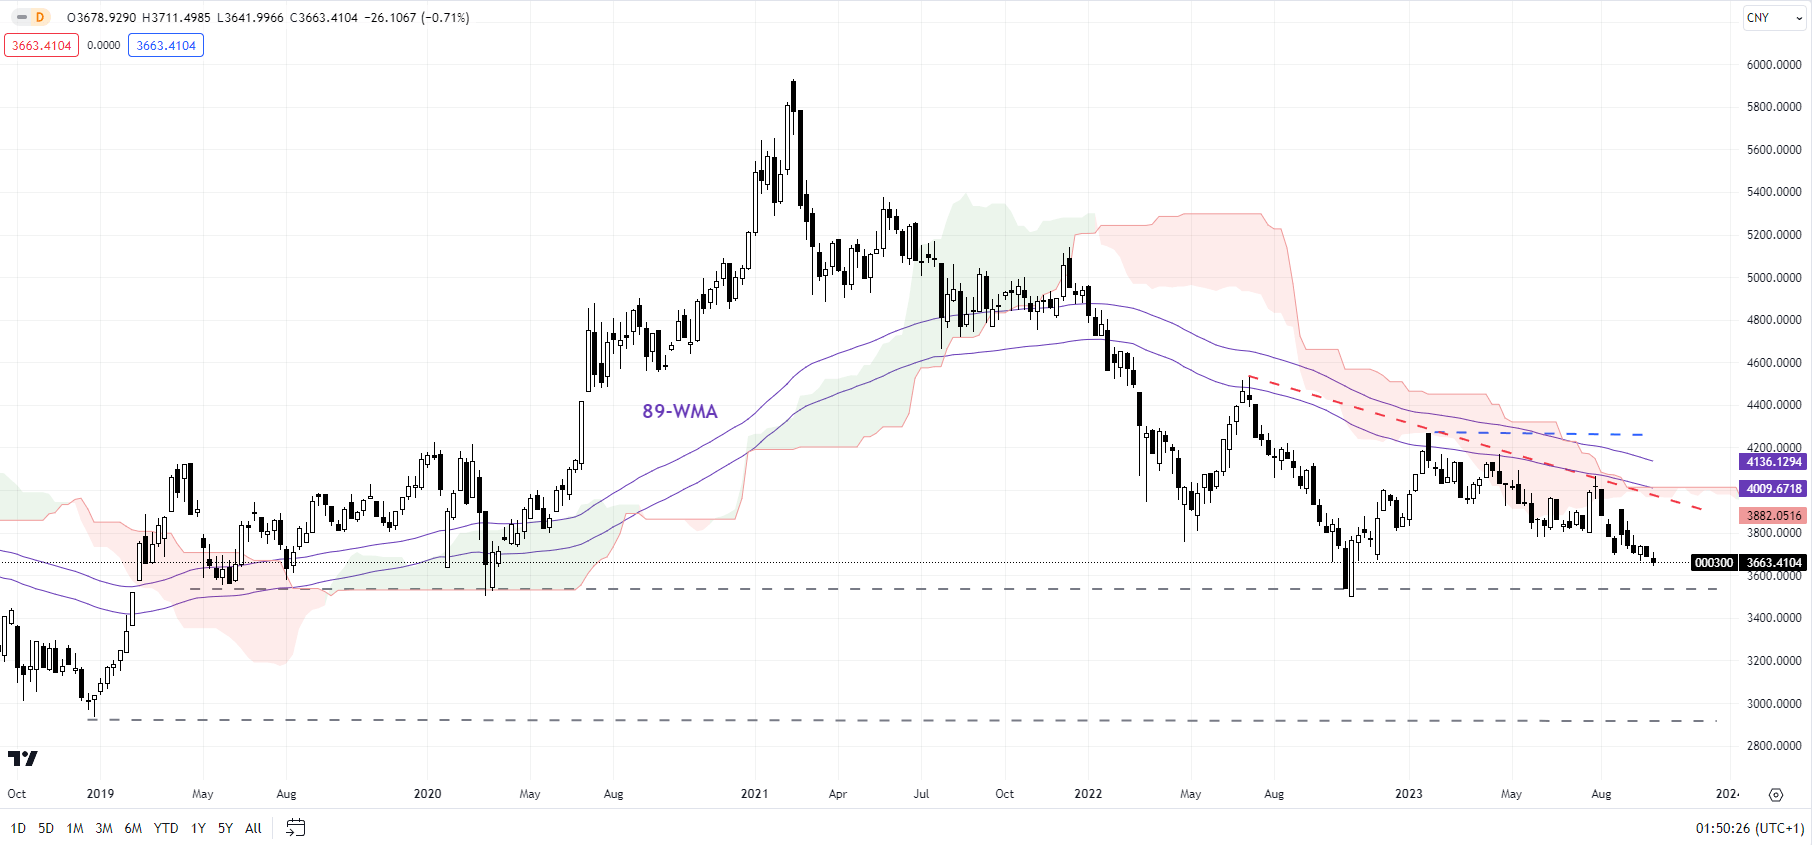
Chart Created by Manish Jaradi Using TradingView
CSI 300: Approaching strong support
From a broader trend perspective, the CSI 300 index continues to be weighed by stiff converged resistance, including the 89-week moving average, coinciding with the upper edge of the Ichimoku cloud on the weekly charts. There is a distinct shift in the trend compared with 2019-2022, where the index was holding above the cloud and the moving average.
For the immediate downward pressure to fade, the index needs to break above 4000-4270, including the February high of 4270, the cloud, and the moving average, the bias remains weak. Any break below strong support on a horizontal trendline since 2019 (at about 3500) could clear the path toward the 2019 low of 2935.
If you’re puzzled by trading losses, why not take a step in the right direction? Download our guide, “Traits of Successful Traders,” and gain valuable insights to steer clear of common pitfalls that can lead to costly errors.
Recommended by Manish Jaradi
Traits of Successful Traders
— Written by Manish Jaradi, Strategist for DailyFX.com
— Contact and follow Jaradi on Twitter: @JaradiManish