USD/CAD, WTI OIL PRICE, CHARTS AND ANALYSIS:
- The Loonie Faces a Key Moment Tomorrow as Inflation Data is Due Ahead of the BoC Meeting Next Week.
- WTI Slides as US-Venezuela Deal Grows Closer. Middle East Tensions Simmer with Developpements Around Iranian Involvement to be Monitored.
- Retail Traders are Currently Short on USDCAD as 61% of Traders Hold Short Positions.
- To Learn More About Price Action,Chart PatternsandMoving Averages, Check out theDailyFX Education Series.
Read More: The Bank of Canada: A Trader’s Guide
USDCAD continued its slide started on Friday pushing further away from the 1.3700 mark. Surprisingly this has come about as Oil prices have struggled as well following a 5% gain on Friday to close the week on a high.
Looking for actionable trading ideas? Download our top trading opportunities guide packed with insightful tips for the fourth quarter!
Recommended by Zain Vawda
Get Your Free Top Trading Opportunities Forecast
RISKS FACING USD/CAD IN THE WEEK AHEAD
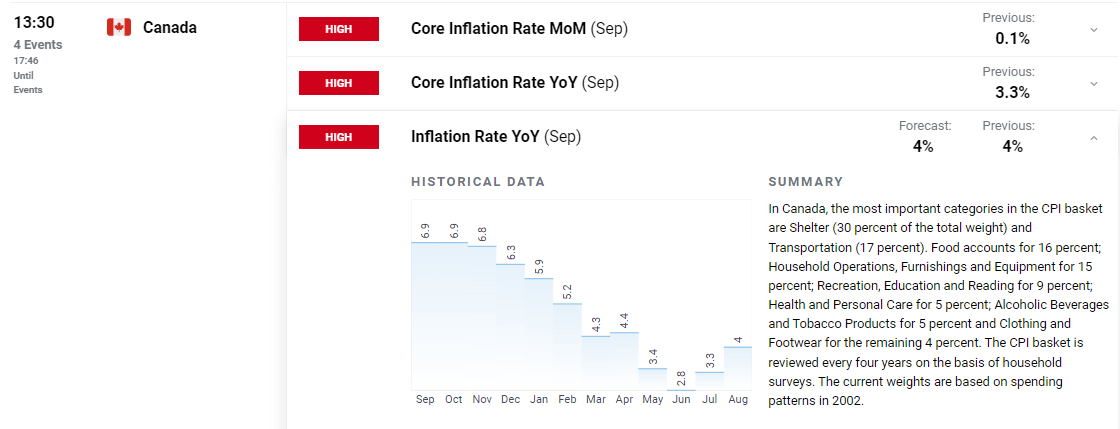
The Bank of Canada (BoC) like many Central Banks globally is keeping a close watch on Geopolitical developments which could have a knock-on effect on inflation. This comes not long after warnings from BoC Deputy Governor Nicolas Vincent who warned that supply shocks, limited competition and technology could have shifted the pricing landscape permanently. Deputy Governor Vincent also said he could envision firms continue to increase prices at larger and more rapid rates which is a worry moving forward.
Canadian Inflation data is due tomorrow and will provide some insight with consensus for YoY Headline inflation resting at 4%. The Bank of Canada (BoC) will no doubt be looking for a print of 4% or lower given the increases the headline figure has seen since printing its YTD low at 2.8% in June. An acceleration tomorrow could see the rate hike expectations for the BoC hawkishly repriced which could USDCAD back toward the 1.3500 psychological level.
For all market-moving economic releases and events, see the DailyFX Calendar
The US is seeing a slight slowdown in high impact risk events this week with the biggest one likely to be Retail Sales data due for release tomorrow as well. This could be a massive day for USDCAD this week before cooling ahead of the BoC rate decision next week.
TECHNICAL ANALYSIS USDCAD
USDCAD failed to print a new high at the back end of last week after finding support at the 20-day MA. We have since seen a pullback as the US dollar took a breath to start the week with Canadian inflation and US retail sales ahead.
The overall trend does however remain bullish with a daily candle close below the 1.3570 swing low from last week needed for a change in trend to occur. That in theory could bring the ascending trendline into play which then could provide some impetus for the bulls to return and eye a fresh high or a new upside leg.
Alternatively, a break of the trendline to the downside opens up a push lower toward support at 1.3370 before the 1.3250 level comes into focus.
USD/CAD Daily Chart
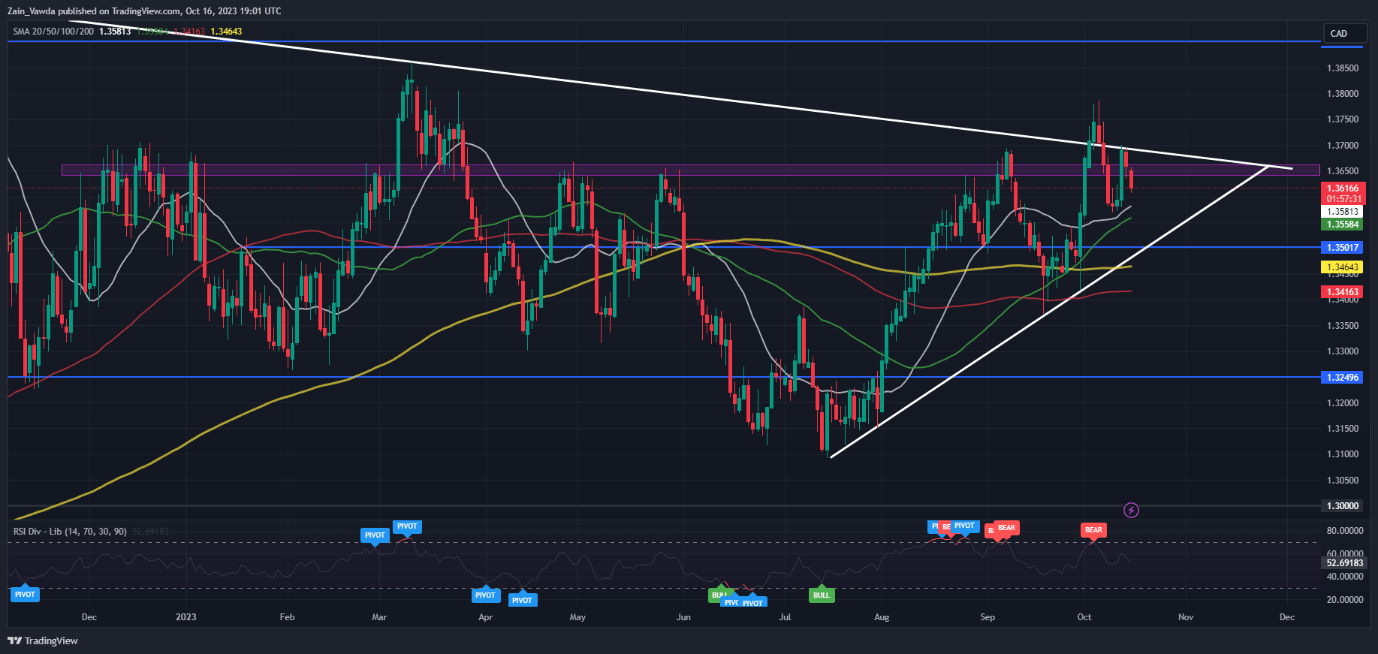
Source: TradingView, prepared by Zain Vawda
IG CLIENT SENTIMENT
Taking a look at the IG client sentiment data and we can see that retail traders are currently net SHORT with 61% of Traders holding short positions.
For Tips and Tricks on How to use Client Sentiment Data, Get Your Free Guide Below
| Change in | Longs | Shorts | OI |
| Daily | 21% | -3% | 5% |
| Weekly | -9% | -5% | -7% |
WTI OIL OUTLOOK
WTI ended the week with a roar printing a Morningstar candlestick pattern, hinting at further upside this week. This however did not materialize today as Oil has struggled to push on helped in part by news that the US and Venezuela could soon reach a deal to ease sanctions if a Presidential election date is set. A deal could be signed as early as Tuesday and may be worth monitoring as it could see Oil prices slide lower on any announcement.
Meanwhile, potential pressure on Oil prices from the conflict in the Middle East have thus far remained at bay as global diplomats attempt to stem the tide and prevent a spread. Another area that should be monitored the longer the tensions in the Middle East continue should the straight of Hormuz which is a chokepoint for nearly 20% of the worlds oil.
For now, though it appears market participants are happy with the efforts to prevent a wider Middle East conflict and could mean the technicals may prove to be a more reliable than they have been of late.
Key Levels to Keep an Eye On:
Support levels:
Resistance levels:
WTI USOIL Daily Chart
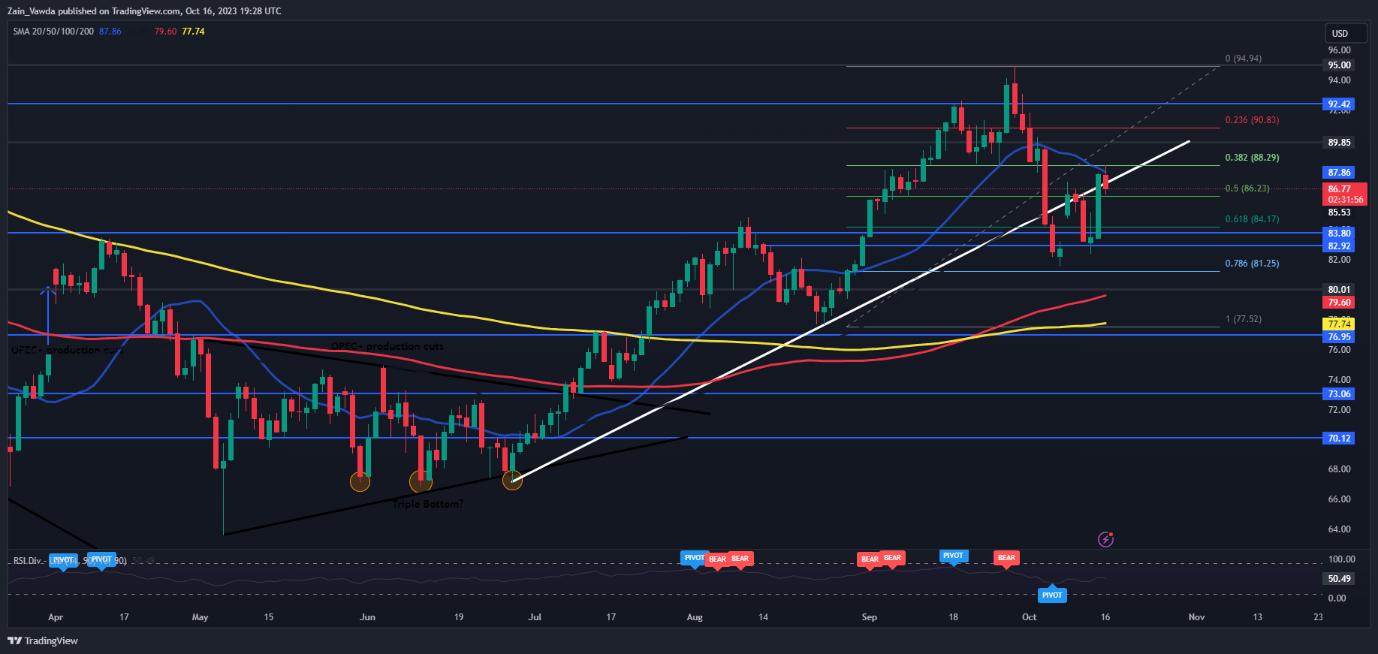
Source: TradingView, Created by Zain Vawda
Elevate your trading skills and gain a competitive edge. Get your hands on the OIL Q4 outlook today for exclusive insights into key market catalysts that should be on every trader’s radar.
Recommended by Zain Vawda
Get Your Free Oil Forecast
— Written by Zain Vawda for DailyFX.com
Contact and follow Zain on Twitter: @zvawda