CRUDE OIL, WTI, NATURAL GAS, NG – Outlook:
- Crude oil has retreated from stiff resistance area.
- Natural gas appears to be holding gains following the recent bullish break.
- What is the outlook for crude oil and natural gas and what are the key levels to watch?
If you’re puzzled by trading losses, why not take a step in the right direction? Download our guide, “Traits of Successful Traders,” and gain valuable insights to steer clear of common pitfalls that can lead to costly errors.
Recommended by Manish Jaradi
Traits of Successful Traders
Crude Oil: Holds below crucial resistance
Crude oil has pulled back from a stiff converged barrier, including the Ichimoku cloud on the weekly charts and the October high of 93.00. Oil needs to cross above this resistance to be able to capitalize on the bullish breakout in September above quite a few times tested resistance on a horizontal trendline since the end of 2022, as highlighted in the previous update. See “Crude Oil to Test $100? Natural Gas is not Out of the Woods Yet,” published September 17.
Crude Oil Weekly Chart
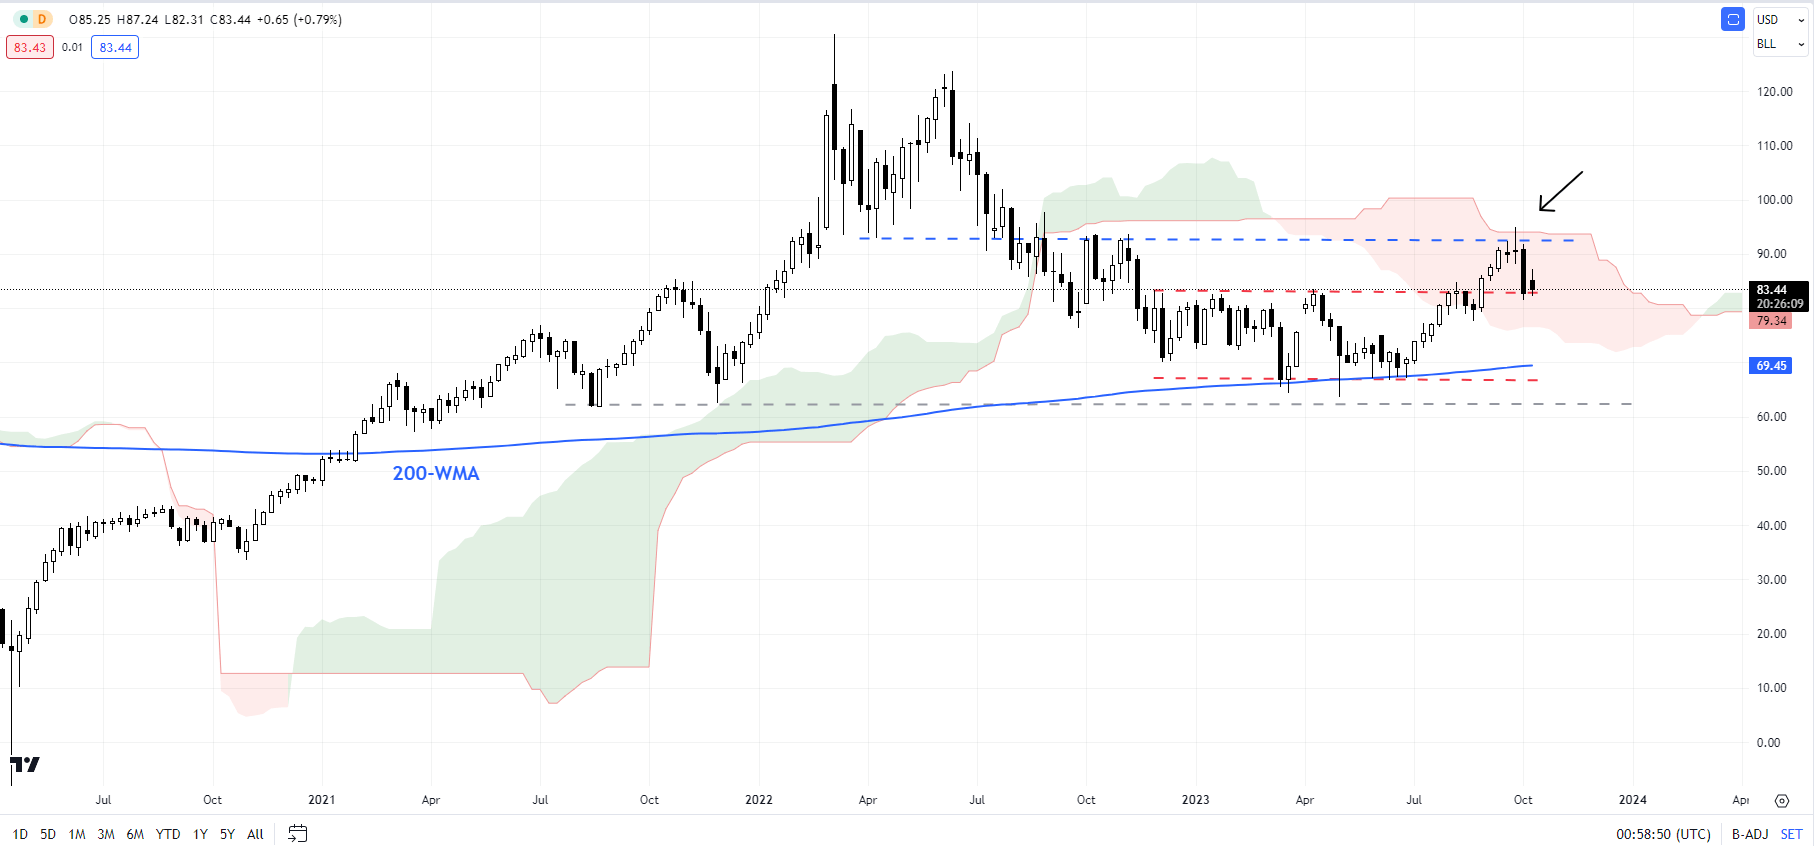
Chart Created by Manish Jaradi Using TradingView
The breakout from the multi-month sideway zone triggered a double bottom (the March and May lows), pointing to a potential rise toward 103. The question then comes up – given the sharp retreat in the recent session, is the rebound over? Probably not. There is no doubt that the immediate upward pressure has faded somewhat (given the fall below the resistance-turned-support at about 84.00), it is too early to say that the bullish move is over.
Crude Oil Daily Chart
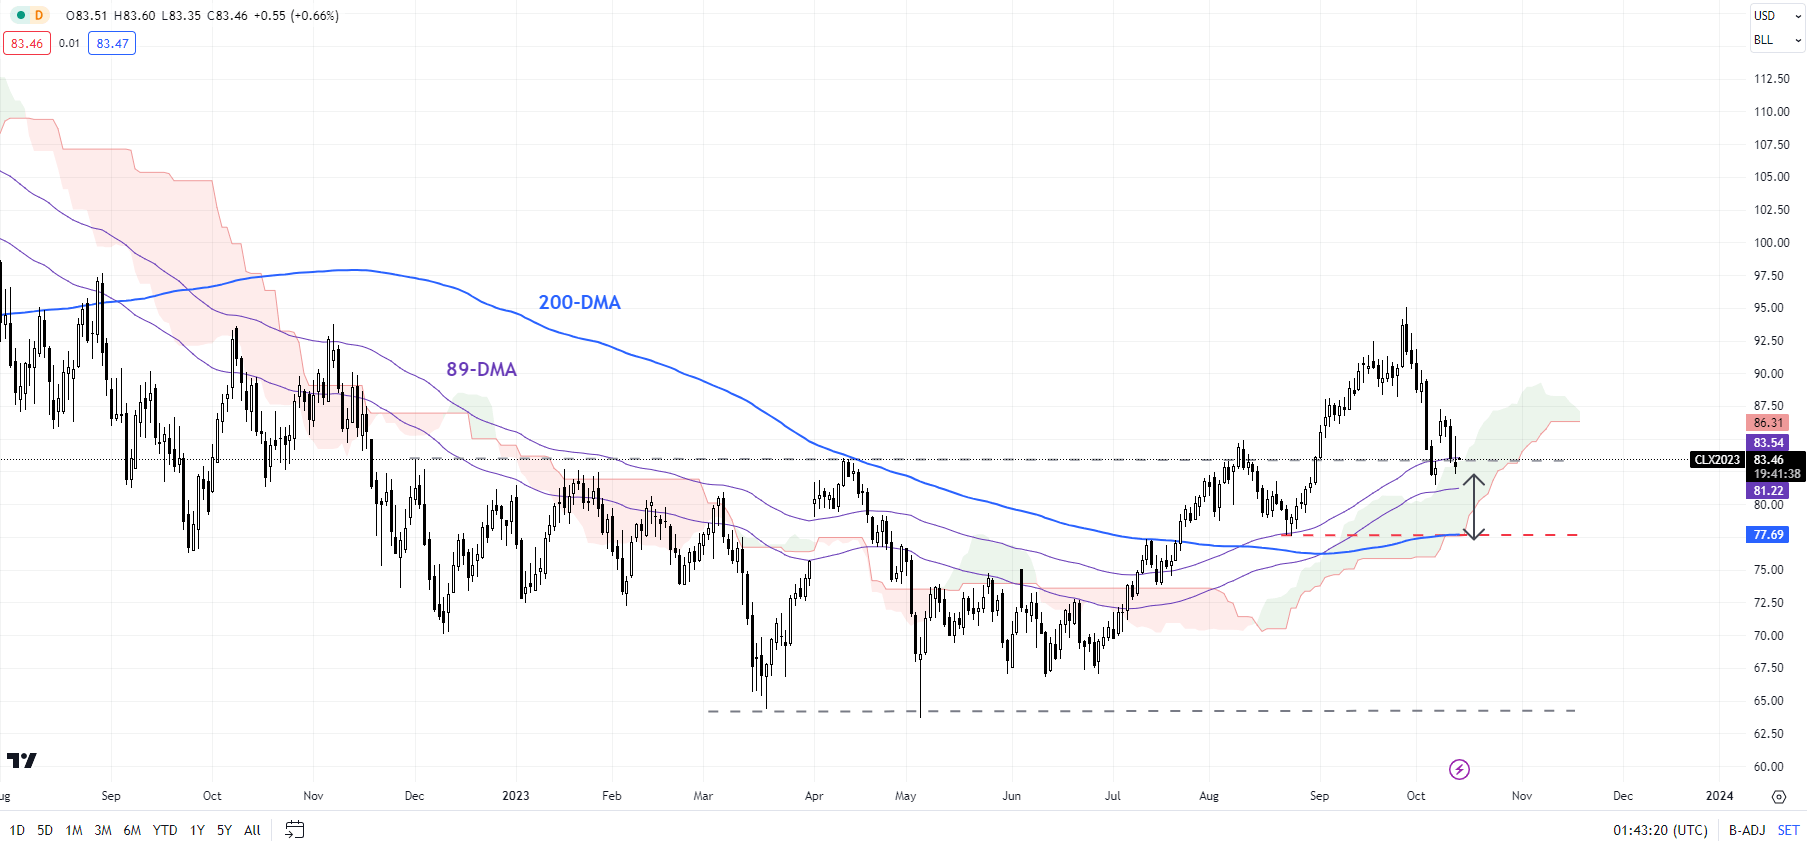
Chart Created by Manish Jaradi Using TradingView
That’s because crude oil continues to trade above the vital cushion zone, including the 200-day moving average, the 89-day moving average, and the August low of 77.50. A break below 77.00-81.00 is needed to confirm the rebound was over.
Looking for actionable trading ideas? Download our top trading opportunities guide packed with insightful tips for the fourth quarter!
Recommended by Manish Jaradi
Get Your Free Top Trading Opportunities Forecast
Natural gas: Stabilizes after breakout
Natural gas is holding gains following the break earlier this month above crucial resistance at the March & August highs of 3.03. The cross above has triggered a significant break out from an eight-month-long sideways range, pointing to a rise to around 4.00-4.10, based on the price objective of the pattern.
For the first time since the end of 2022, has risen above the 200-day moving average and a decisive break above the 89-day moving average, suggesting that the base building may have taken place. For more details see “Bullish Natural Gas: Base May Have Been Built,” published October 9.
Natural Gas Daily Chart
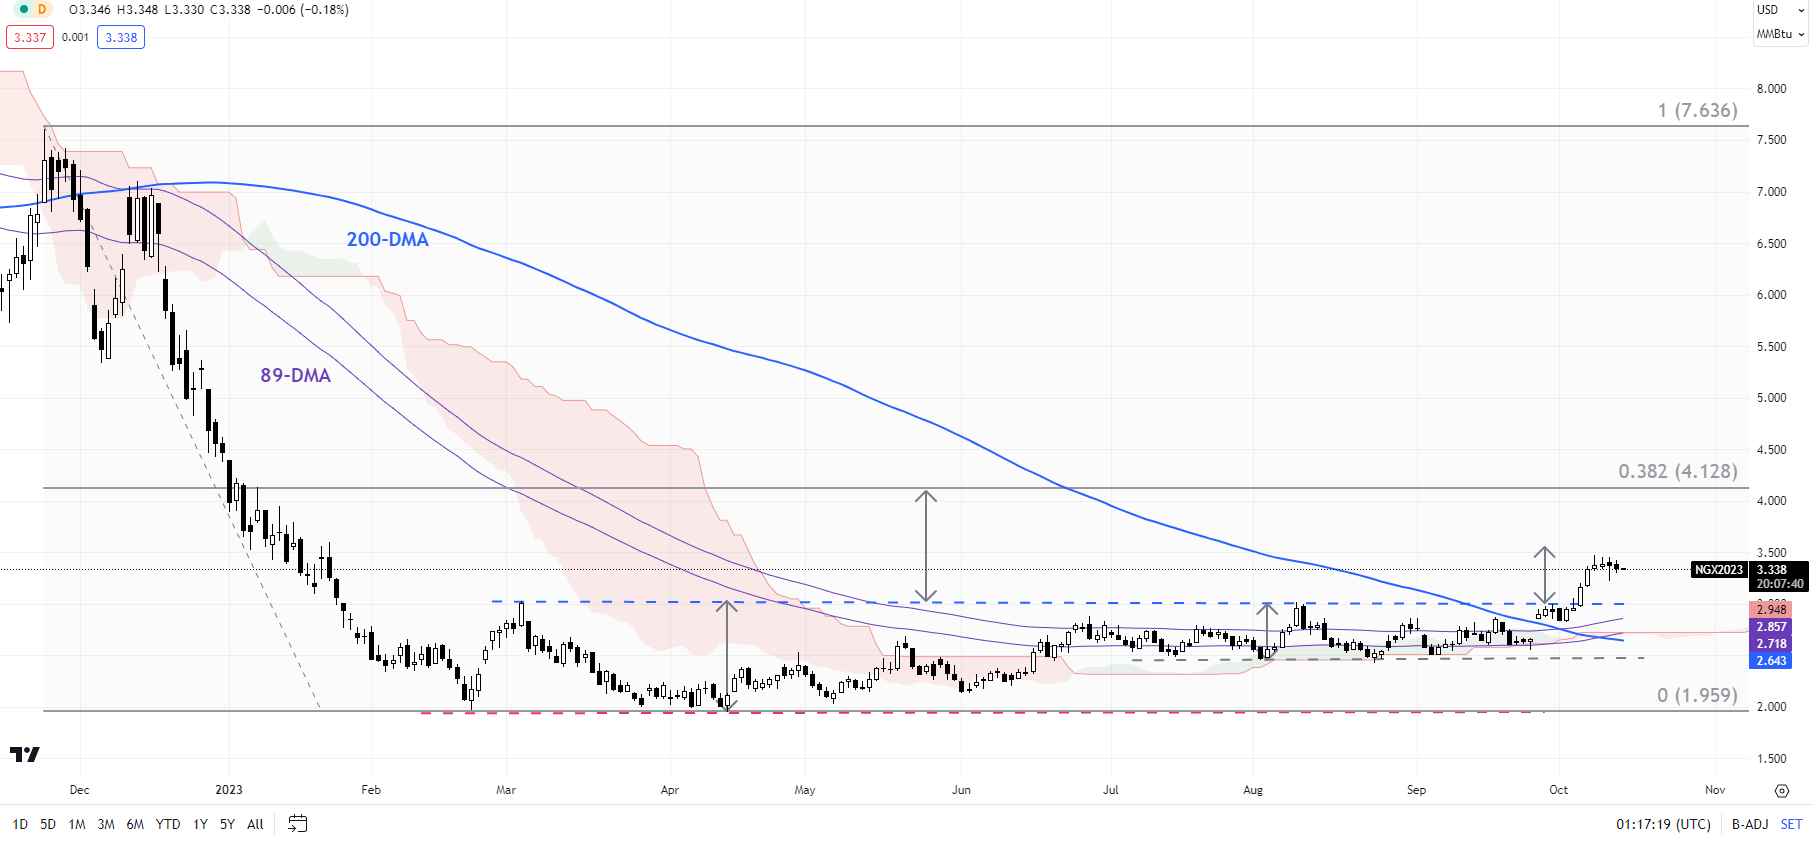
Chart Created by Manish Jaradi Using TradingView
Natural gas faces immediate resistance at 3.25 (the 23.6% retracement of the November 2022-February 2023 fall, the stronger barrier at 4.20 (the 50% retracement. As highlighted in the previous update, natural gas needs to stay above the August low of 2.40 for the bullish bias to remain intact. Immediate support is at 3.03.
Elevate your trading skills and gain a competitive edge. Get your hands on the Crude oil outlook today for exclusive insights into key market catalysts that should be on every trader’s radar.
Recommended by Manish Jaradi
Get Your Free Oil Forecast