Trade Smarter – Sign up for the DailyFX Newsletter
Receive timely and compelling market commentary from the DailyFX team
Subscribe to Newsletter
Most Read: Gold Price Forecast: Bearish Winds Prevail but Turnaround Nears, XAU/USD Levels
The U.S. dollar, as measured by the DXY, embarked on a furious rally on Thursday after hotter-than-expected U.S. September inflation data sent Treasury yields sharply higher and increased the likelihood that the Fed will deliver another quarter-point rate hike at its December meeting. In this context, the Loonie (CAD) and the Aussie (AUD) suffered a major setback and took a beating against the greenback, with both currencies nearing their weakest levels in several months. Detailed technical analyses for AUD/USD and USD/CAD are provided below in consideration of these developments.
USD/CAD TECHNICAL ANALYSIS
USD/CAD surged on Thursday, blasting past a key technical ceiling at 1.3640 and pushing towards the 1.3700 handle, another important level that could cap further advances.
With a strong bullish momentum firmly in place for USD/CAD and prices following a well-defined uptrend, it may pose a considerable challenge for sellers to regain control of the market, suggesting that the path of least resistance may be higher.
In terms of possible scenarios, if the pair manages to clear the 1.3700 mark decisively, the bears may throw in the towel, setting the stage to move towards the October’s swing high, which hovers just below the 1.3800 threshold. On further strength, the focus shifts to the 2023 peak.
Conversely, if prices turn lower from their current position and begin to retreat unexpectedly, initial support is seen at 1.3640, but further losses could be in store on a push below this area, with the next downside target located at 1.3570.
Discover the power of crowd mentality in FX trading. Download the sentiment guide to understand how USD/CAD positioning can influence the underlying trend!
| Change in | Longs | Shorts | OI |
| Daily | -9% | 4% | -1% |
| Weekly | 4% | 2% | 3% |
USD/CAD TECHNICAL CHART
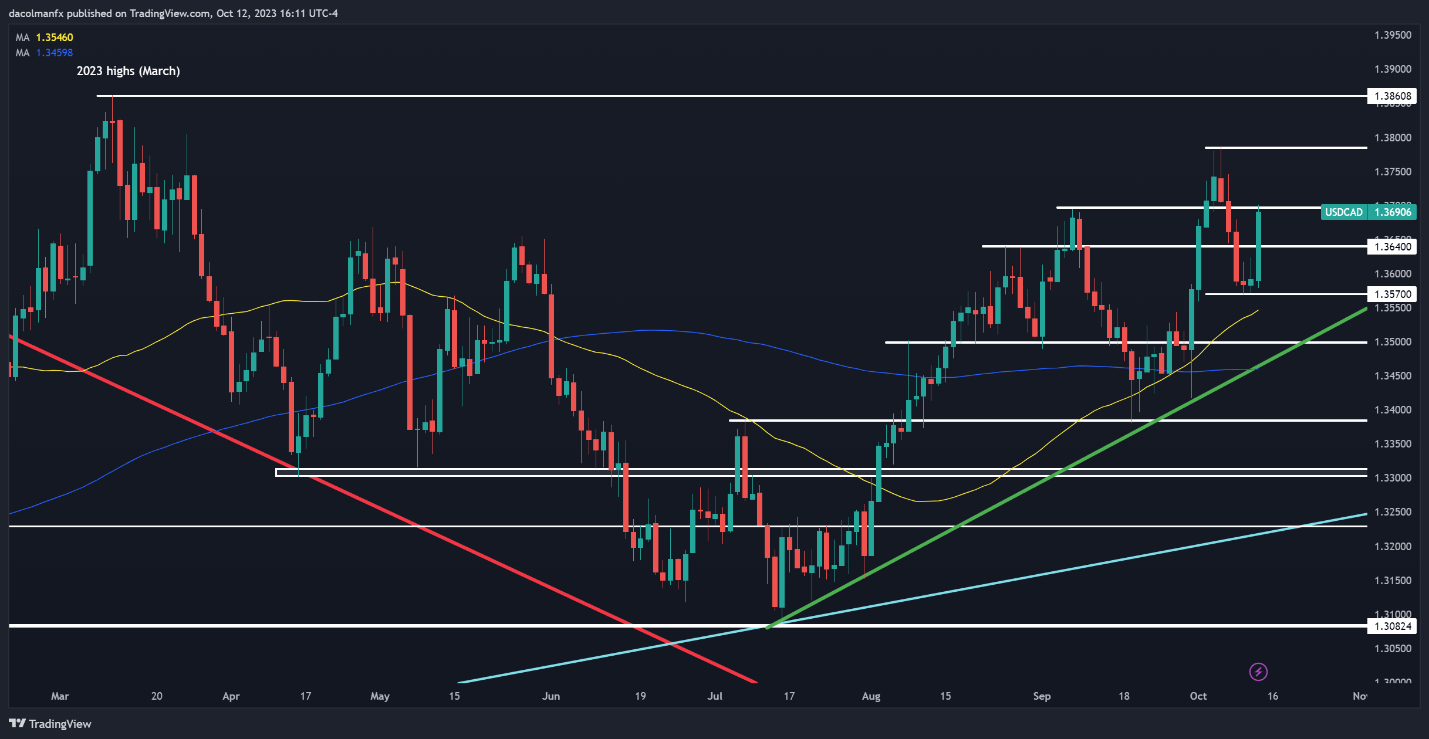
USD/CAD Chart Created Using TradingView
AUD/USD TECHNICAL ANALYSIS
Everything was going well for AUD/USD until earlier this week. The pair had bounced more than 2% from multi-month lows and was on a steady recovery trajectory, but then its rebound abruptly hit a roadblock when prices collided with trendline resistance and the 50-day simple moving average, situated just above the 0.6400 handle.
Right after testing the 0.6400 area, sellers made a strong comeback, initiating a robust bearish reversal that pushed prices below support at 0.6350. With the market firmly in the grip of the bears, it may only be a matter of time before a move toward the 2023 lows unfolds. AUD/USD could find a foothold in this area on a retest, but in the event of a breakdown, we could see a pullback towards the 2022 lows.
On the flip side, if sentiment improves and the Australian dollar accelerates higher, initial resistance is located at 0.6350. Clearing this hurdle may breathe fresh life into the upward impetus, potentially opening the path for an advance toward trendline resistance, currently positioned close to the psychological 0.6400 level. With continued strength, the prospect of reaching 0.6460 is worth considering.
Curious to know what’s on the horizon for AUD/USD? Download our free Q4 trading guide for exclusive insights into key market catalysts that should be on every trader’s radar and can influence the course of the Australian dollar!
Recommended by Diego Colman
Get Your Free AUD Forecast
AUD/USD TECHNICAL CHART
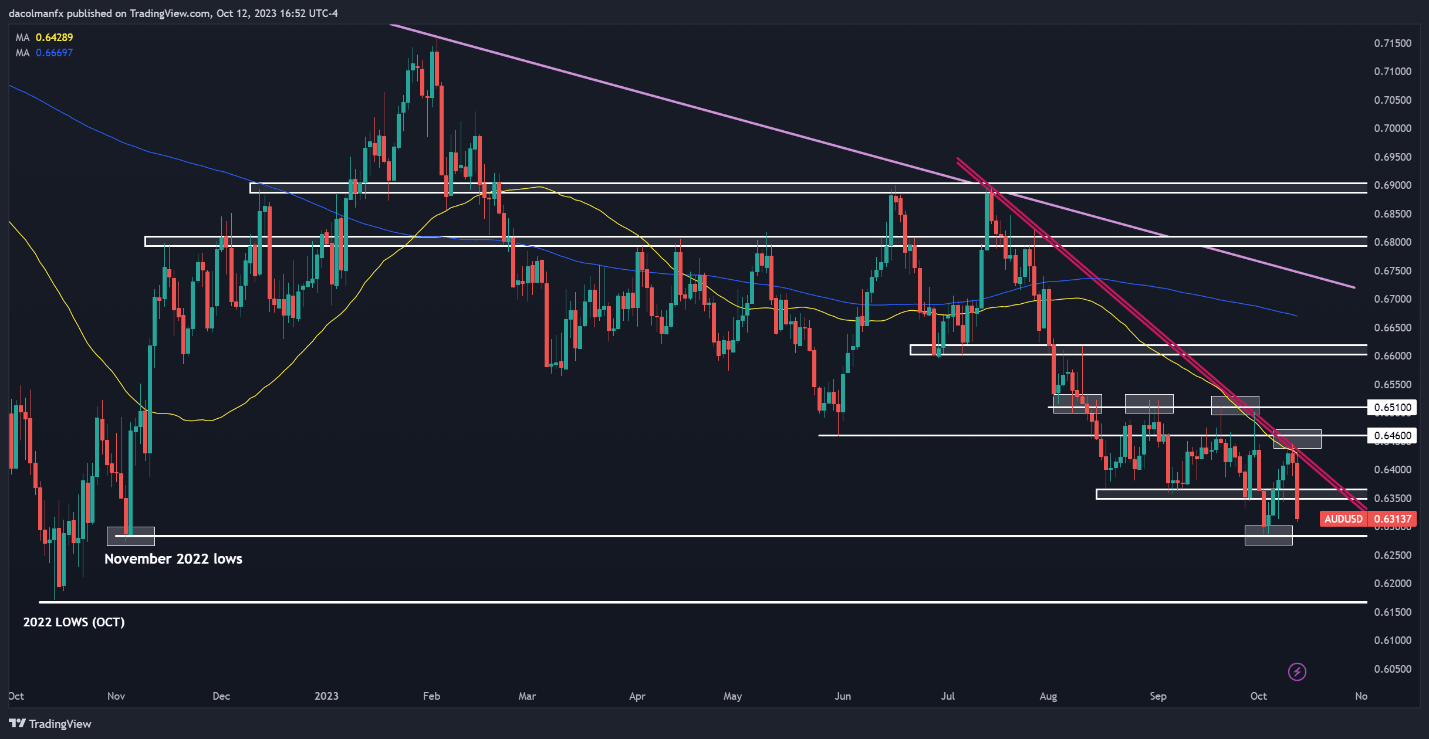
AUD/USD Technical Chart Prepared Using TradingView