With Q1 posting a strong showing for US equities, find out if the second quarter is likely to perform in much the same way by reading our comprehensive Q2 equities forecast:
Recommended by Chris Beauchamp
Get Your Free Equities Forecast
Dow holds trendline support
Sharp losses over the first two days of last week took the price back from near 40,000, but Wednesday’s session saw a stabilisation.
The price continues to hold trendline support from the mid-January low, which provides an underpinning for a resumption of the move to new record highs.
A break of trendline support would then see the 50-day simple moving average (SMA) come into view.
Dow Jones Daily Chart
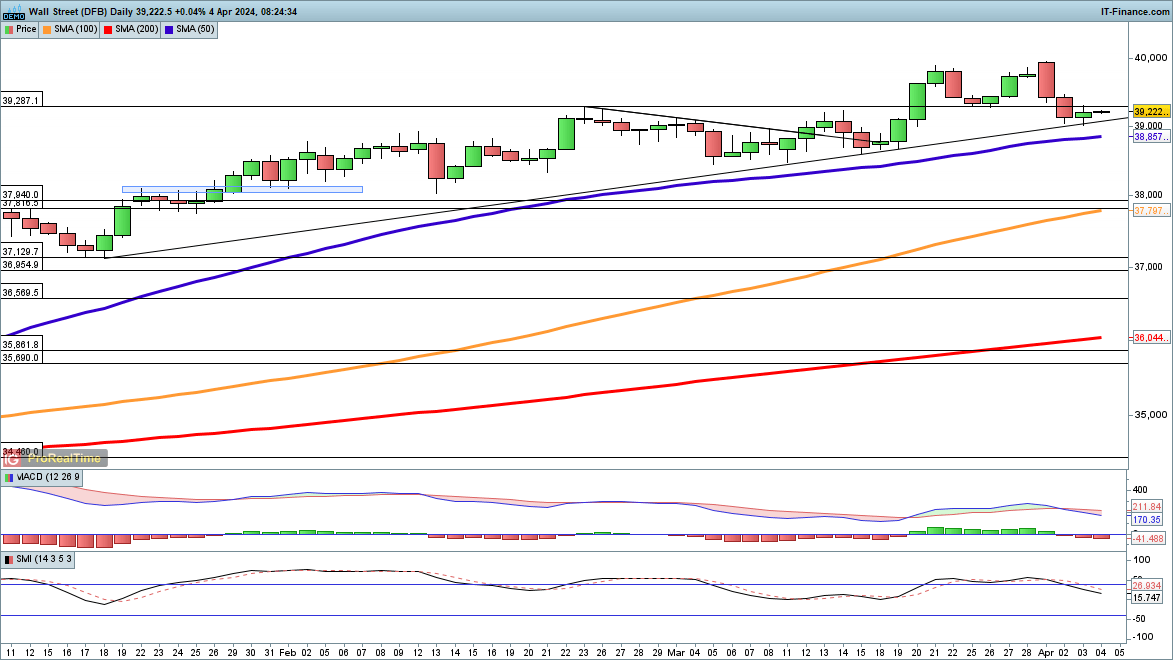
Source: IG, ProRealTime
Nasdaq 100 stabilises
The index saw a strong rebound on Wednesday, bringing a halt to the drift lower of the past two weeks. If the 18,000 level continues to hold then a fresh move to a new peak could begin.
If the price drops below 18,000 then the 50-day SMA is another area of possible support, swiftly followed by 17,800 and then 17,656 in the event of further declines.
Nasdaq 100 Daily Chart
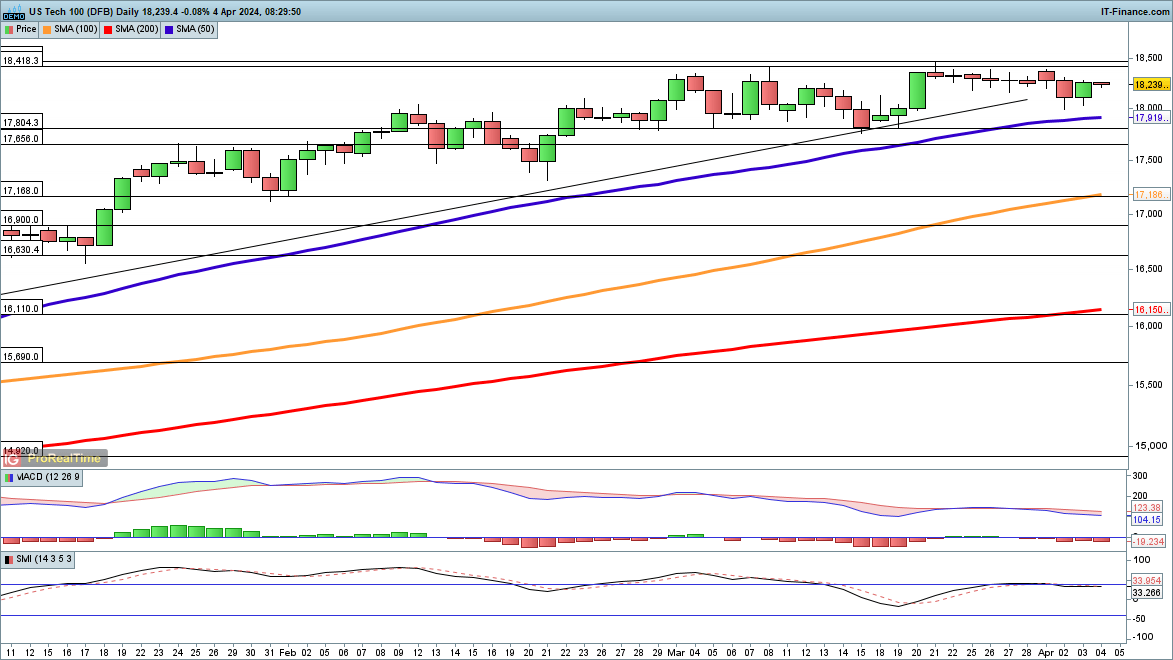
Source: IG, ProRealTime
Looking for actionable trading ideas? Download our top trading opportunities guide packed with insightful tips for the second quarter!
Recommended by Chris Beauchamp
Get Your Free Top Trading Opportunities Forecast
Hang Seng moves higher
The price bottomed out in the second half of March around 16,350, and since then it has continued to recover.
While it remains below the declining 200-day SMA and below the high seen in the first half of March around 17,150, the overall move higher off the lows of January remains intact.
For now the downtrend that dominated 2023 is on pause. A close back below 16,300 could signal that sellers have reasserted control, while a close above the 200-day SMA and then above the early March high continues to bolster the bullish view.
Hang Seng Daily Chart
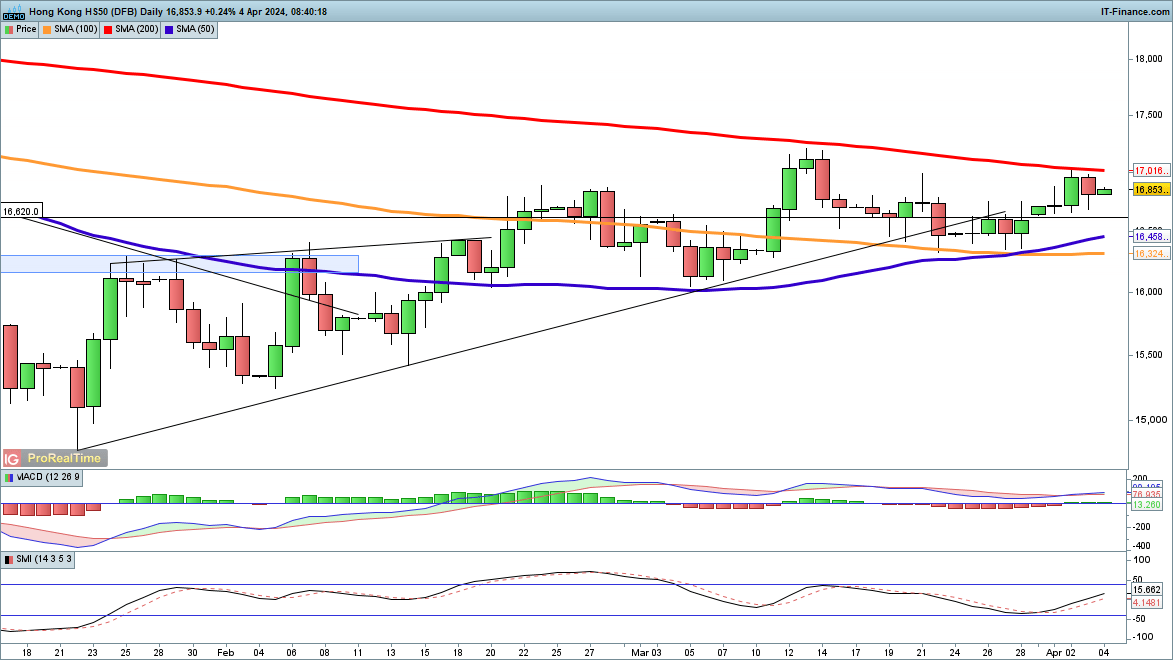
Source: IG, ProRealTime