USD/JPY, Fed Analysis
Recommended by Richard Snow
Introduction to Forex News Trading
Yen Looking Vulnerable Ahead of FOMC and All-Important Dot Plot
The yen continued to weaken against the dollar in the London AM session ahead of the crucial FOMC decision this evening. While there is no realistic expectation of a change in the Fed funds rate, market participants are eagerly awaiting the Fed’s ‘dot plot’ which maps out individual views on the likely path of interest rates in 2024, 2025, 2026 and in the ‘long-run’.
Stubborn US inflation has revealed its head in some form or another since December last year, forcing markets to factor in the potential for just two cuts this year (50 bps) and reinforce the need to keep rates elevated for longer. A relatively robust economy and a tight labour market add to the reasons why financial conditions may not be as tight as initially thought.
Fed Dot Plot from December 2023
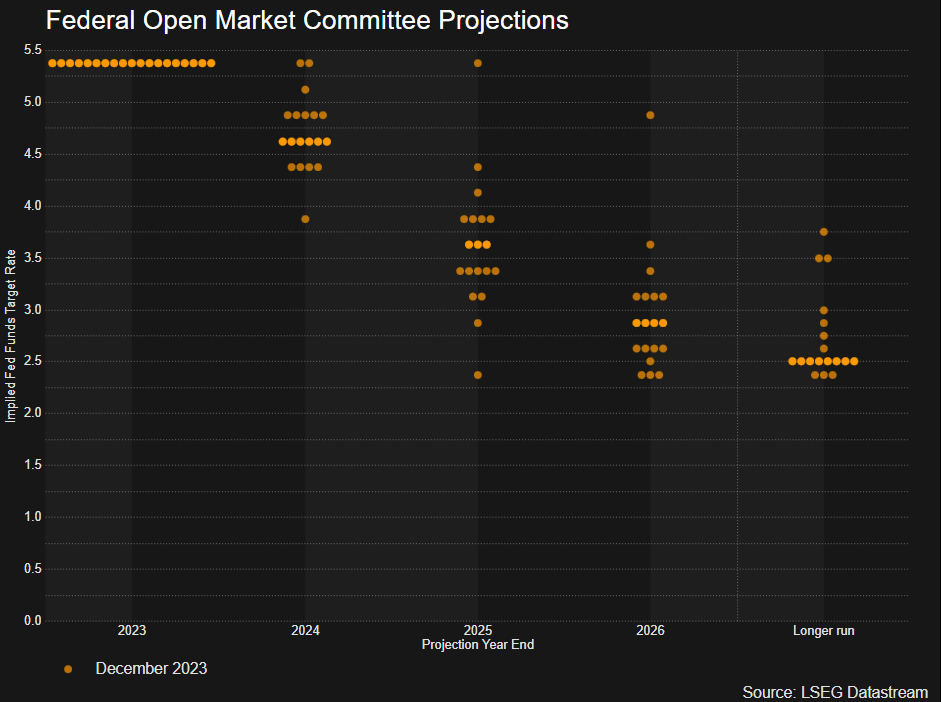
Source: US Federal Reserve, Refinitiv Workspace
Apart from the Fed’s dot plot, markets will be looking for clues on the timing of the first rate cut, as expectations are shifting from June towards July – something that is likely to support the greenback and weigh on the yen. In the early hours of Tuesday morning,
Customize and filter live economic data via our DailyFX economic calendar
USD/JPY Builds on Positive Momentum – Yen Sinks Post-BoJ Selloff
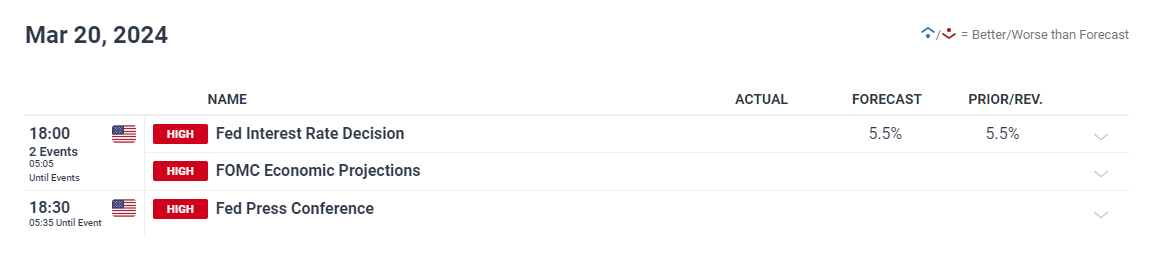
The yen has really struggled in the lead up to the BoJ rate hike on Tuesday after the Bank issued a very accommodative statement to support a historic decision to exit negative interest rates. Hiking interest rates normally provides some form of support for the local currency but when you consider the vast interest rate differential between the yen and most other major currencies, there is still a long way to go to reverse the carry trade.
Constructed, Equal-Weighted Japanese Yen Index (USD/JPY, GBP/JPY, EUR/JPY, AUD/JPY)
Source: TradingView, prepared by Richard Snow
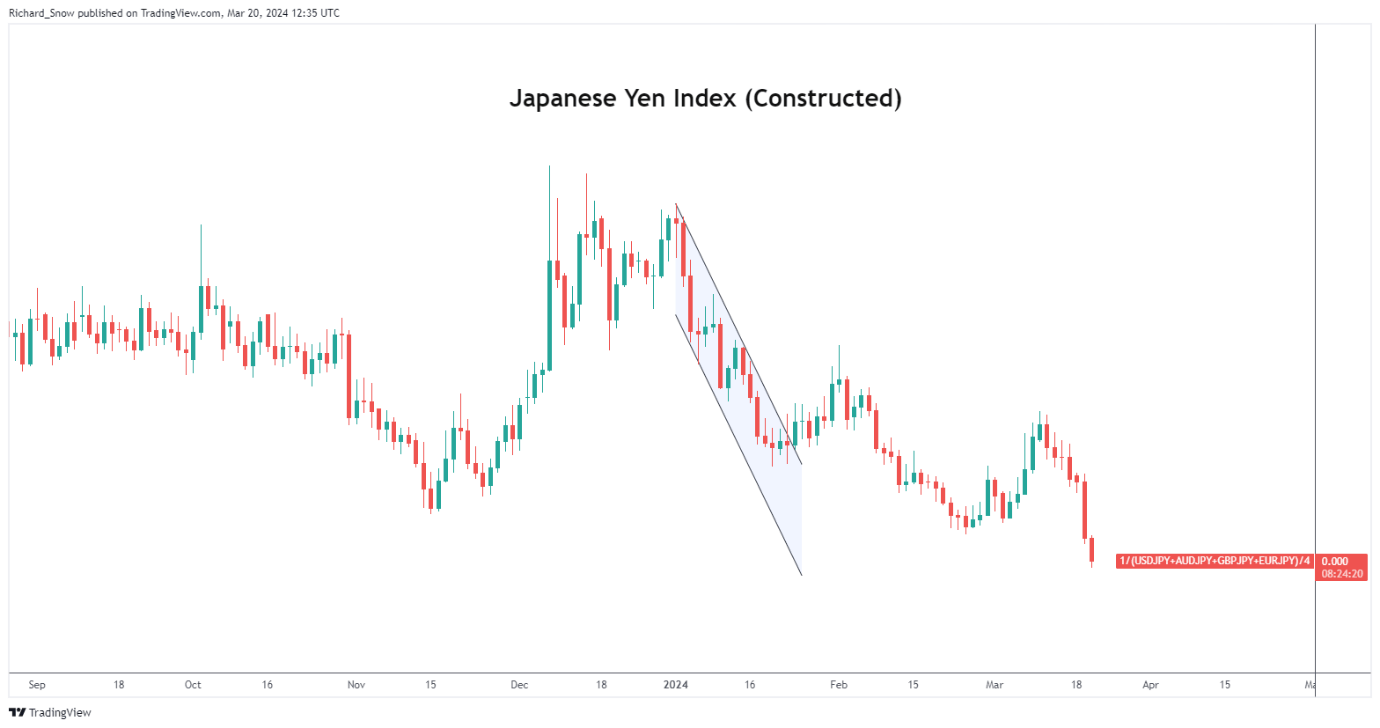
The daily USD/JPY chart shows the bullish acceleration from yesterday which has continued into today. Smashing past 150.00 with ease, the pair is currently testing the November swing high of 151.90 but fast approaching oversold territory via the RSI – meaning the move may soon look to pullback slightly before making a push towards levels not seen in 34-years. The 150 marker has now turned into support and could come back into play if the dot plot remains unchanged for 2024 (three rate cuts) but any dollar softness is likely to be short-lived given the fact the economy remains robust and signs of stubborn inflation are yet to disappear.
USD/JPY Daily Chart
Source: TradingView, prepared by Richard Snow
USD/JPY is one of the more liquid FX pairs and often allows traders a way to speculate on interest rates via the carry trade phenomenon. Learn more here:
Recommended by Richard Snow
How to Trade USD/JPY
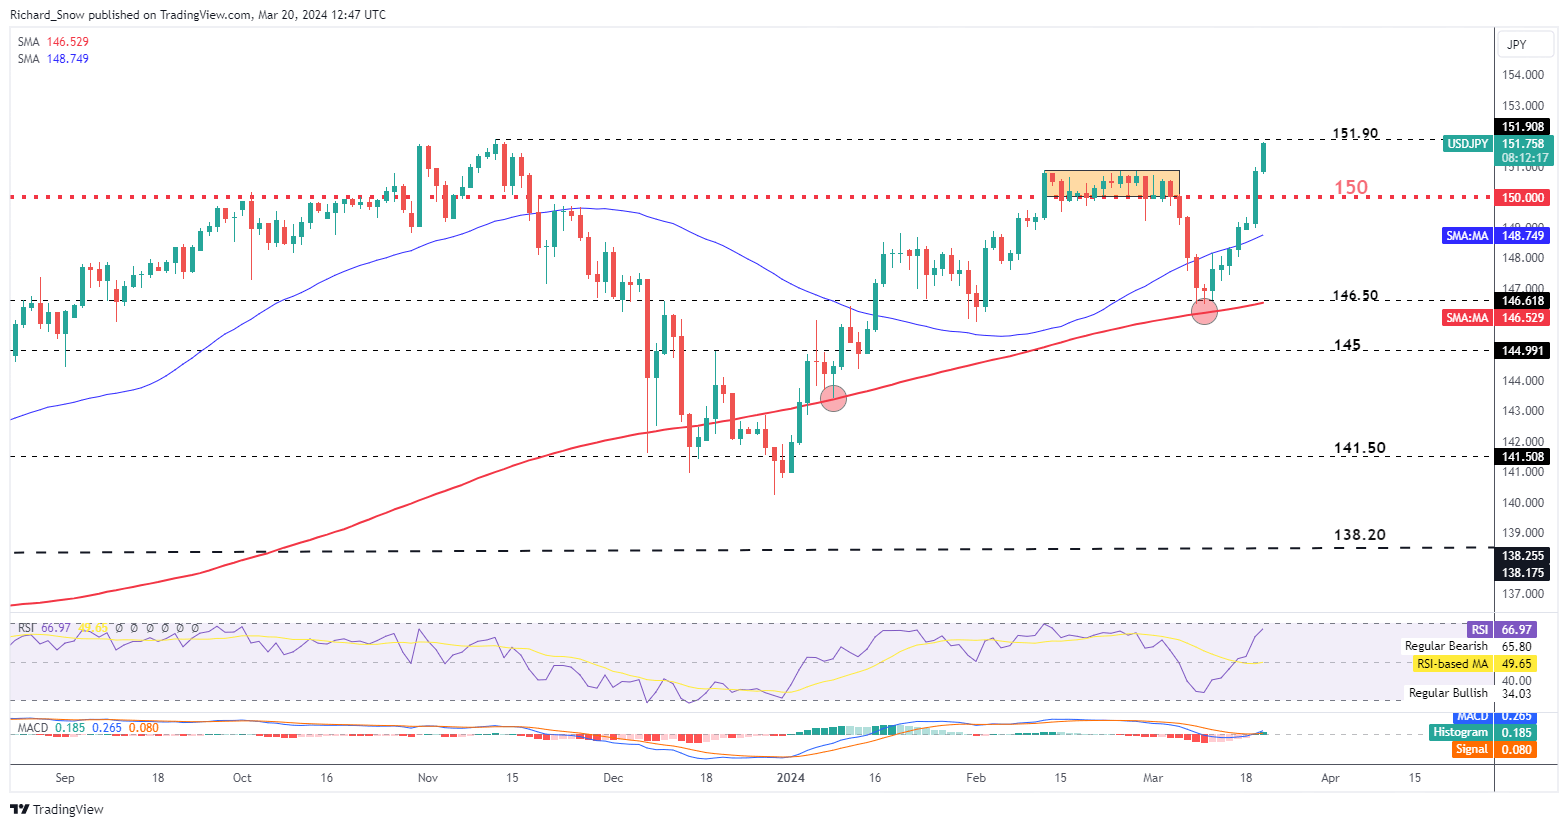
The weekly chart shows the broader, longer-term ascending channel which continues making higher highs and higher lows. The chart also highlights that such elevated levels have attracted attention from the Japanese Finance Ministry – although the main point of concern had been undesirable volatility at the time. The recent volatility is likely to warrant similar dissatisfaction meaning FX intervention threats to strengthen the yen may enter the fray once more.
USD/JPY Weekly Chart
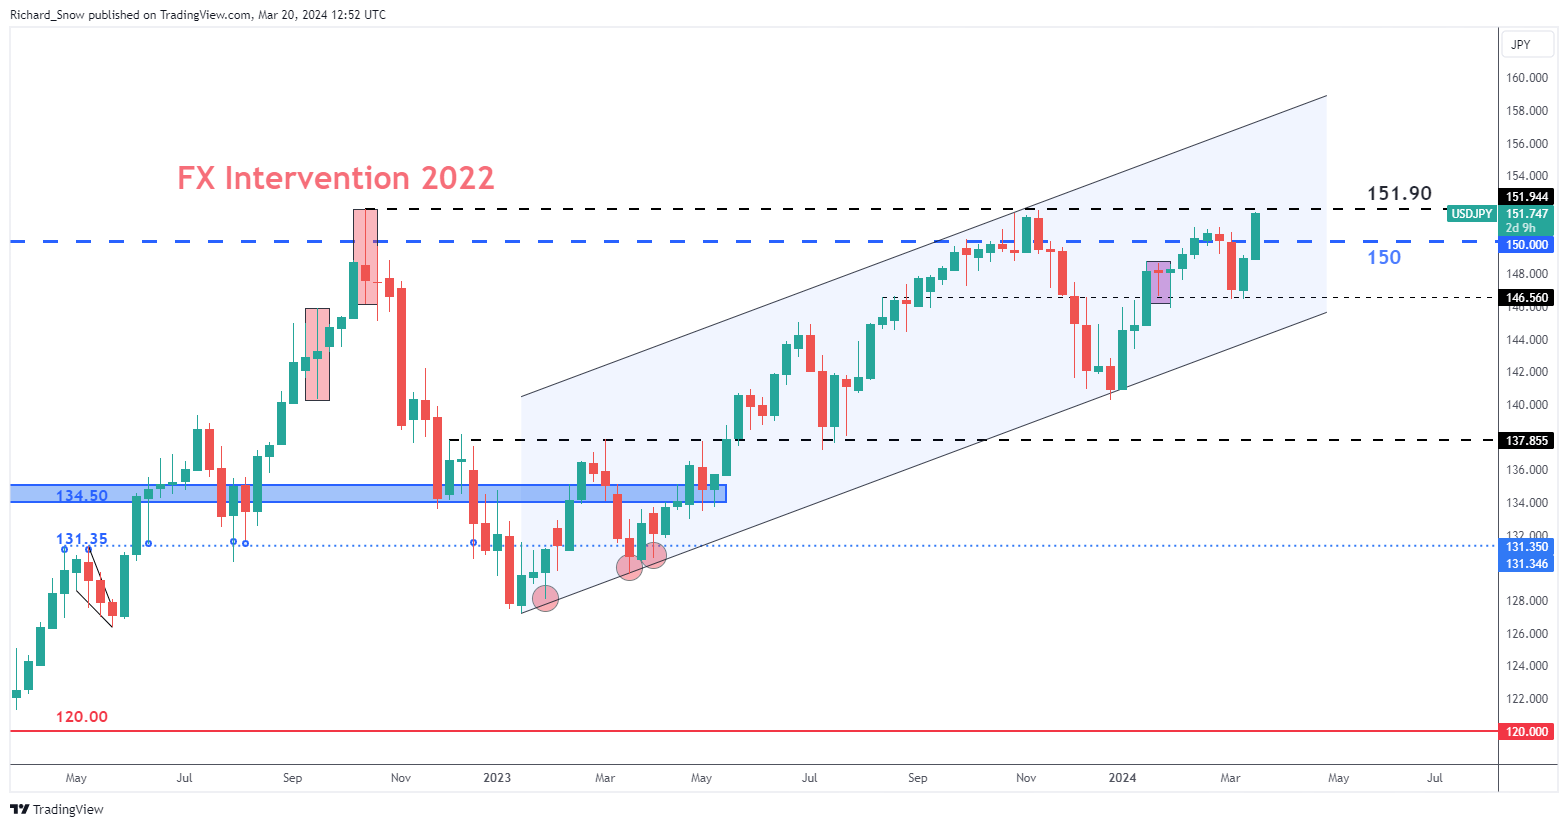
Source: TradingView, prepared by Richard Snow
— Written by Richard Snow for DailyFX.com
Contact and follow Richard on Twitter: @RichardSnowFX