US DOLLAR FORECAST – EUR/USD, USD/JPY, GBP/USD
- The U.S. dollar finishes the week moderately lower, easing off multi-month highs
- All eyes will on the March U.S. inflation report in the week ahead
- This article discusses the technical outlook for EUR/USD, USD/JPY and GBP/USD
Most Read: USD/JPY Tiptoes Towards Bullish Breakout after Strong US Jobs Data. What Now?
The U.S. dollar, as measured by the DXY index, lost ground over the past five trading sessions, marking the end of a three-week winning streak that had propelled prices to 5-month highs by Tuesday. When all was said and done, the DXY retreated 0.24% to settle at 104.28, with the euro’s strength being the primary factor behind this movement.
Despite this subdued performance, the greenback should not be written off just yet, as it may be able to restart its advance and regain momentum soon, especially if the March U.S. inflation report, due for release on Wednesday, beats projections and confirms Wall Street’s worst nightmare: progress on disinflation has hit a roadblock.
Consensus estimates suggest headline CPI climbed 0.3% on a seasonally adjusted basis last month, lifting the annual rate to 3.4% from 3.2% previously. The core gauge is also seen rising 0.3% month-on-month, but the 12-month reading is projected to have slowed to 3.7% from 3.8% in February, a positive but tiny step in the right direction.
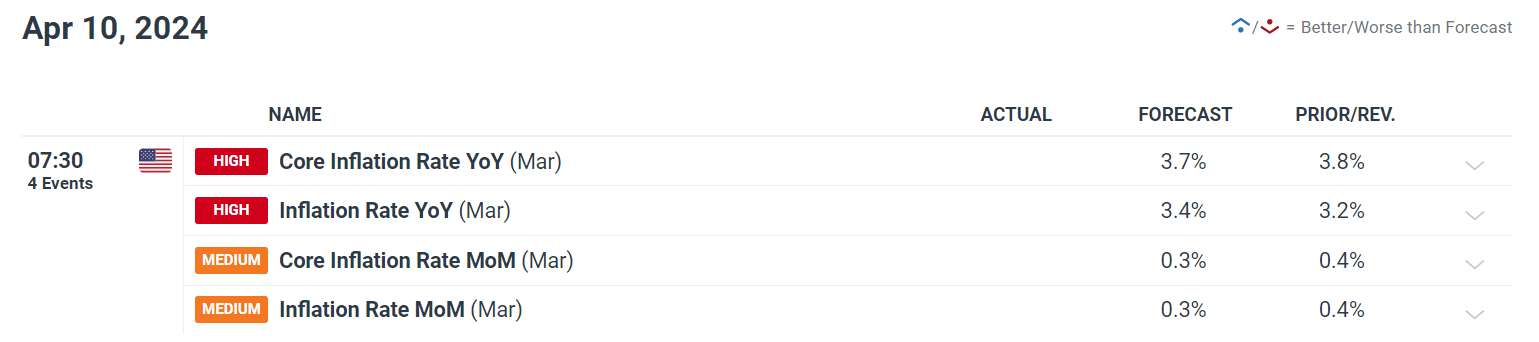
Source: DailyFX Economic Calendar
RECENT FEDSPEAK
Fed Chair Powell, in a speech at the Stanford Business, Government, and Society Forum earlier this week, stated that nothing has changed for the FOMC in terms of its policy outlook outlined in the latest Summary of Economic Projections, signaling that 75 basis points of easing remains on the table for the year. His comments appeared to deflate the U.S. dollar as we moved towards the latter part of the week.
Although Powell is the most important voice at the Federal Reserve, other officials are beginning to express reservations about committing to a preset course. Fed Governor Michelle Bowman, for instance, has indicated that headway in disinflation efforts has stalled and that she wouldn’t be comfortable cutting rates until renewed price pressures abate. She also mentioned that hiking rates again is possible, though not likely.
Access our Q2 trading forecast to get a detailed analysis of the U.S. dollar’s medium-term outlook. Download it for free today & don’t miss out on key strategies!
Recommended by Diego Colman
Get Your Free USD Forecast
Fed Dallas President Lorie Logan also seemed to have embraced a more aggressive posture, emphasizing that it’s too early to consider easing measures. In support of her viewpoint, she cited hotter-than-expected CPI readings lately and signs that elevated borrowing costs may not be restraining aggregate demand as much as originally thought.
All things considered, if the inflation outlook continues to evolve unfavorably, the U.S. central bank may have no other choice but to start coalescing around a more hawkish position, with the robustness of the labor market giving policymakers plenty of wiggle room to be patient before pivoting to a looser stance. This could mean delayed interest rate reductions and shallow cuts this year once the process finally gets underway.
The following table shows the probabilities of Fed action at various FOMC meetings.
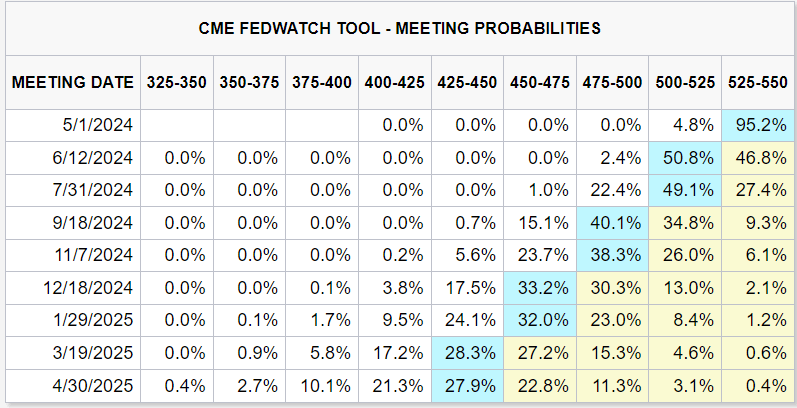
Source: CME Group
In light of the aforementioned points, traders should closely watch the upcoming inflation numbers and brace for volatility. That said, an upside surprise in the data, particularly in the core metric, could reinforce the upswing in U.S. Treasury yields seen in the first days of April, allowing the U.S. dollar to resume its upward journey and command leadership in the FX space.
Meanwhile, a lower-than-anticipated print on the all-items and core indices could have the opposite effects on markets, resulting in lower government rates and a softer U.S. dollar. However, for this scenario to play out, the divergence of the final data from expectations would need to be substantial; otherwise, the impact on bonds and the U.S. currency would be more measured.
For a complete overview of the EUR/USD’s technical and fundamental outlook for the coming months, make sure to download our complimentary Q2 forecast!
Recommended by Diego Colman
Get Your Free EUR Forecast
EUR/USD TECHNICAL ANALYSIS
EUR/USD dipped to multi-week lows at the start of the week, only to rebound from trendline support around 1.0725, with this bounce propelling prices above both the 50-day and 200-day simple moving averages. Should the pair build upon its recent recovery over the coming sessions, Fibonacci resistance emerges at 1.0865. On further strength, all eyes will be on 1.0915.
Alternatively, should sellers regain control and drive prices below the key moving averages mentioned earlier, a retreat towards 1.0840 might ensue. Bulls must vigorously defend this technical floor; a failure to do so might exacerbate negative sentiment towards the euro, potentially triggering a drop towards the 1.0700 handle. Below this area, attention should gravitate towards 1.0625.
EUR/USD PRICE ACTION CHART
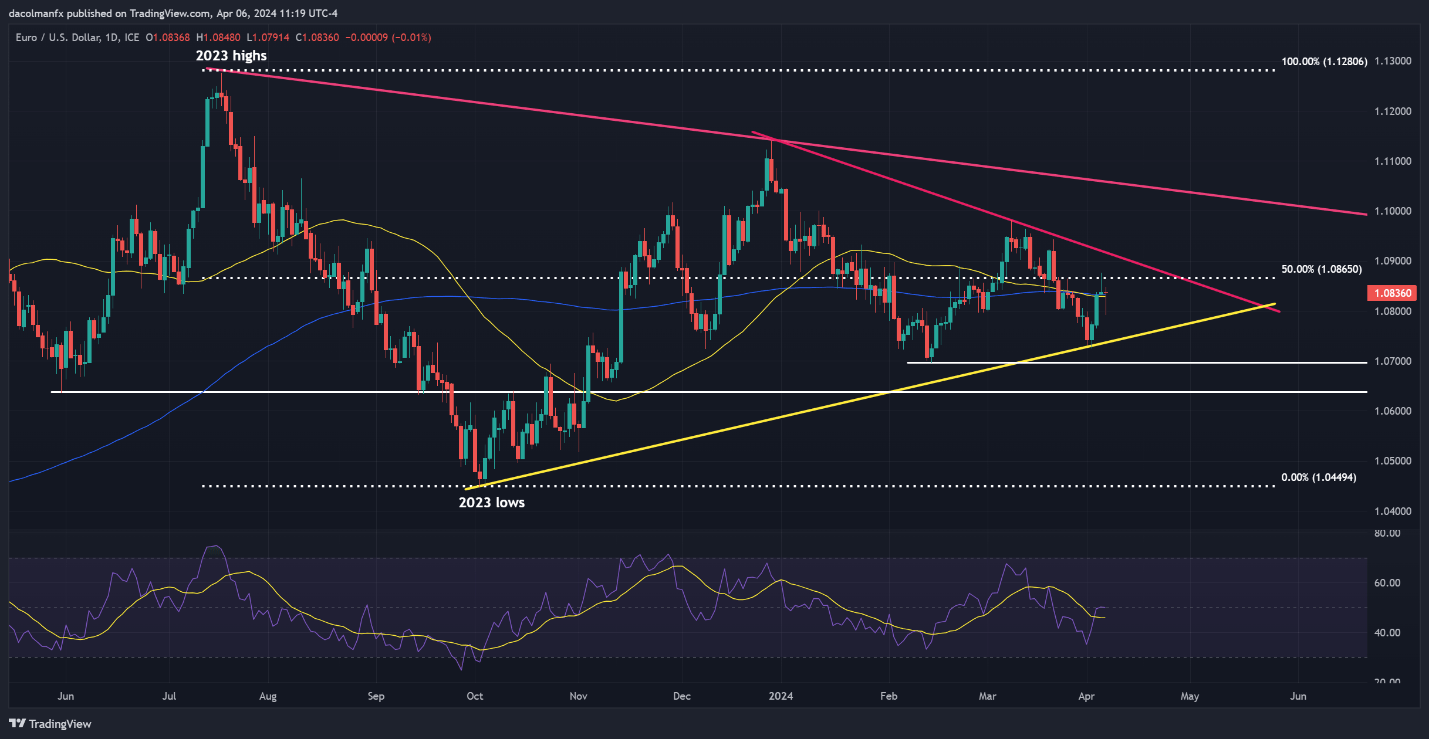
EUR/USD Chart Created Using TradingView
Wondering about USD/JPY’s medium-term prospects? Gain clarity with our latest forecast. Download it now!
Recommended by Diego Colman
Get Your Free JPY Forecast
USD/JPY TECHNICAL ANALYSIS
USD/JPY has exhibited range-bound behavior over the past two weeks, oscillating between resistance near 152.00 and support at 150.90. This suggests a consolidation period is underway. With that in mind, traders should be on the lookout for either a breakout (152.00) or a breakdown at (150.90) for guidance on the near-term outlook.
In the event of bullish breakout, a rally towards the upper boundary of a short-term ascending channel at 155.25 may follow, provided Tokyo stays on the sidelines and refrains from intervening in the FX space to support the yen. Conversely, in case of a breakdown, sellers could begin to trickle back into the market, setting the stage for a drop towards 149.75 (50-day SMA), followed by 148.85.
USD/JPY PRICE ACTION CHART
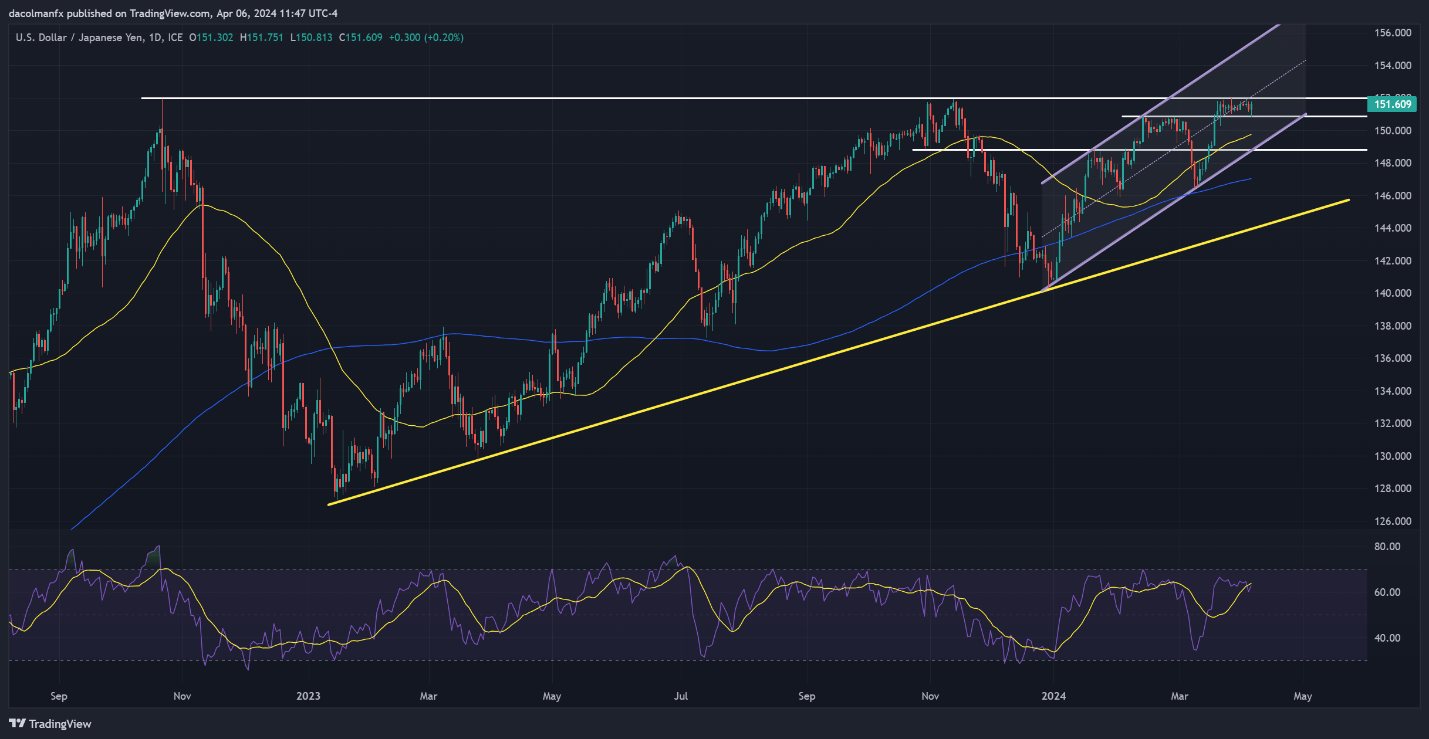
USD/JPY Chart Created Using TradingView
Keen to understand how FX retail positioning can offer hints about the short-term direction of major pairs such as GBP/USD? Our sentiment guide holds valuable insights on this topic. Download it today!
| Change in | Longs | Shorts | OI |
| Daily | 6% | -17% | -5% |
| Weekly | -10% | 4% | -5% |
GBP/USD TECHNICAL ANALYSIS
GBP/USD fell early in the week but bounced back in the following days, ultimately reclaiming its 200-day SMA. However, the upward impulse faded when prices failed to clear cluster resistance at 1.2670, near the intersection of three key trendlines. Traders should monitor this area closely, keeping in mind that a bearish rejection could send cable tumbling back towards 1.2590 and possibly even 1.2520.
On the other hand, if the bulls succeed in pushing the exchange rate above 1.2670 in a decisive fashion, buying interest could pick up traction in the upcoming trading sessions, fostering conditions for a potential climb towards the 1.2800 handle. Further upside progression beyond this juncture could open the door to a retest of last month’s high in the vicinity of 1.2895.
GBP/USD PRICE ACTION CHART
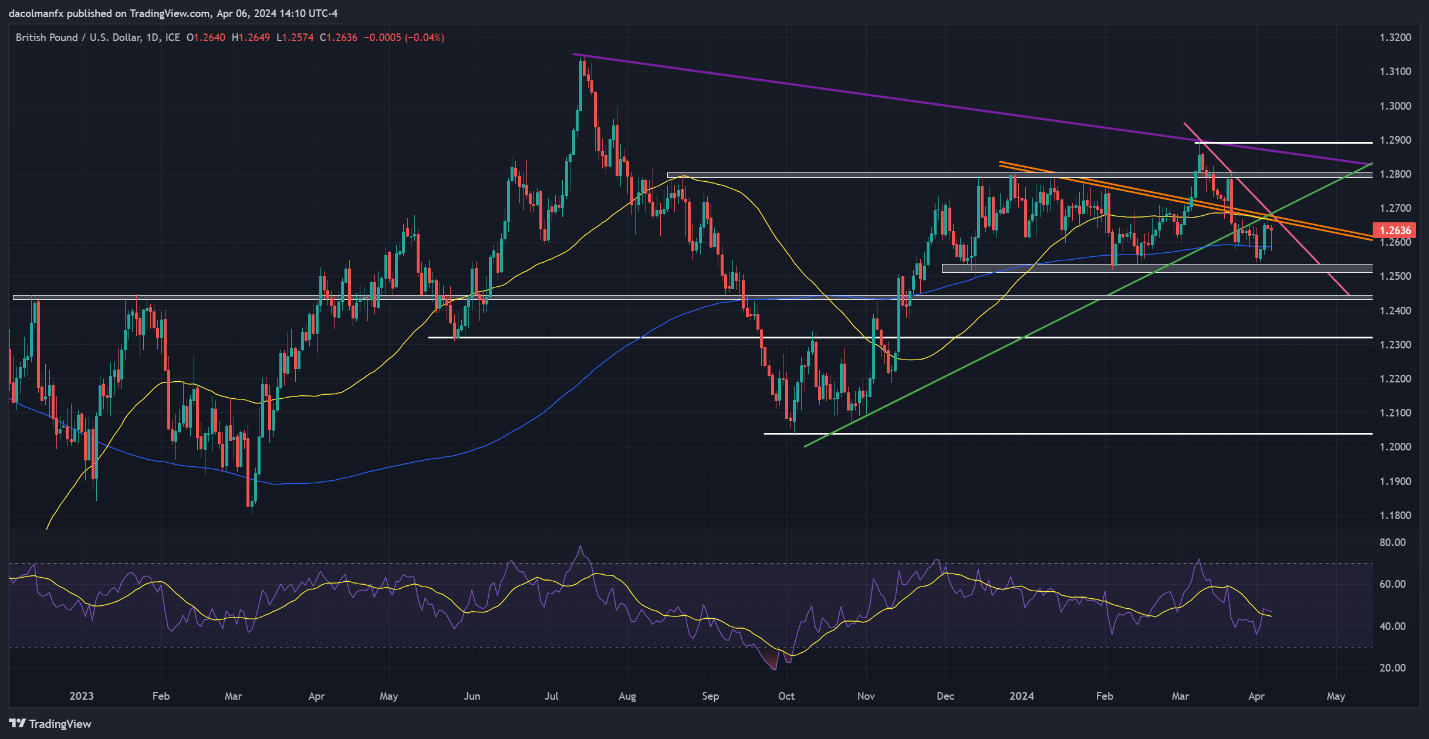
GBP/USD Chart Created Using TradingView