Most Read: British Pound Outlook & Market Sentiment – GBP/USD, GBP/JPY, EUR/GBP
The U.S. dollar surged on Thursday after a subdued performance in recent days, boosted by soaring U.S. Treasury yields following higher-than-anticipated February’s PPI numbers, released on the heels of Tuesday’s hot CPI report.
Labor market data, showing that the number of Americans applying for jobless benefits stayed at historically low levels last week, further solidified the greenback’s gains by bolstering confidence in the country’s economic prospects.
Presented below are key economic releases from today’s session.
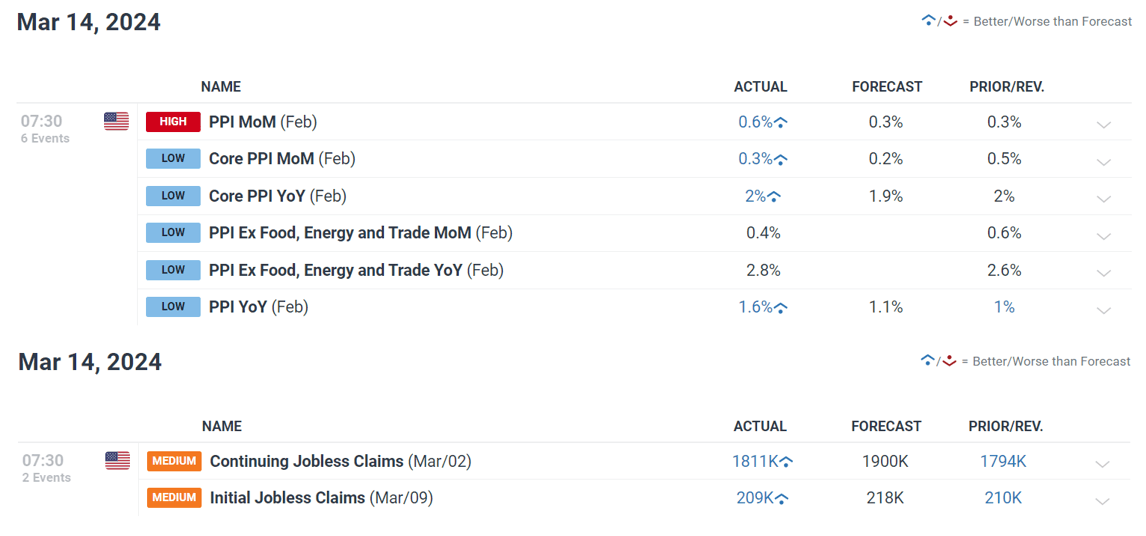
Source: DailyFX Economic Calendar
Although the Fed has indicated that it would likely be appropriate to remove policy restriction this year, stagnating progress on disinflation, juxtaposed with the economy’s resilience, could reduce the scope of incoming rate cuts and perhaps delay the start of the easing cycle, currently projected for June.
We will know more about the FOMC’s monetary policy outlook next week when policymakers gather for their March meeting and release updated macro projections (SEP), including the dot-plot – a diagram that maps out Fed officials’ estimates of how borrowing costs are likely to evolve over various years.
With upside inflation risks starting to materialize, traders should not be surprised if the central bank signals fewer rate reductions for 2024 compared to three months ago. This scenario could keep bond yields biased upwards in the near term, reinforcing the greenback’s bullish comeback.
Want to know where EUR/USD is headed over the coming months? Explore all the insights available in our quarterly forecast. Request your complimentary guide today!
Recommended by Diego Colman
Get Your Free EUR Forecast
EUR/USD FORECAST – TECHNICAL ANALYSIS
EUR/USD fell sharply on Thursday, but managed to hold above confluence support around 1.0875. Bulls must protect this technical floor tooth and nail; failure to do so could result in a pullback towards 1.0850, followed by 1.0790. On further weakness, all eyes will be on 1.0725.
On the other hand, if buyers trigger a bullish reversal and prices rebound off current levels, resistance is located at 1.0980 and 1.1020 thereafter. Above these thresholds, the focus will be on 1.1075, a key ceiling created by a medium-term descending trendline.
EUR/USD PRICE ACTION CHART

EUR/USD Chart Created Using TradingView
Wondering about the yen‘s outlook – will it weaken or recover in the near term? Discover all the details in our quarterly forecast. Don’t miss out – request your complimentary guide today!
Recommended by Diego Colman
Get Your Free JPY Forecast
USD/JPY FORECAST – TECHNICAL ANALYSIS
USD/JPY extended its rebound on Thursday, coming within striking distance from reclaiming its 50-day simple moving average at 148.40. The market reaction here will be key, with a breakout possibly fueling an advance towards 148.90, followed by 149.70.
Conversely, if renewed selling pressure emerges and drives the exchange rate lower, support looms at 147.50. Below this floor, market focus will shift towards the 200-day simple moving average, located near 146.40, and subsequently towards February’s swing lows in the vicinity of 146.00.
USD/JPY PRICE ACTION CHART
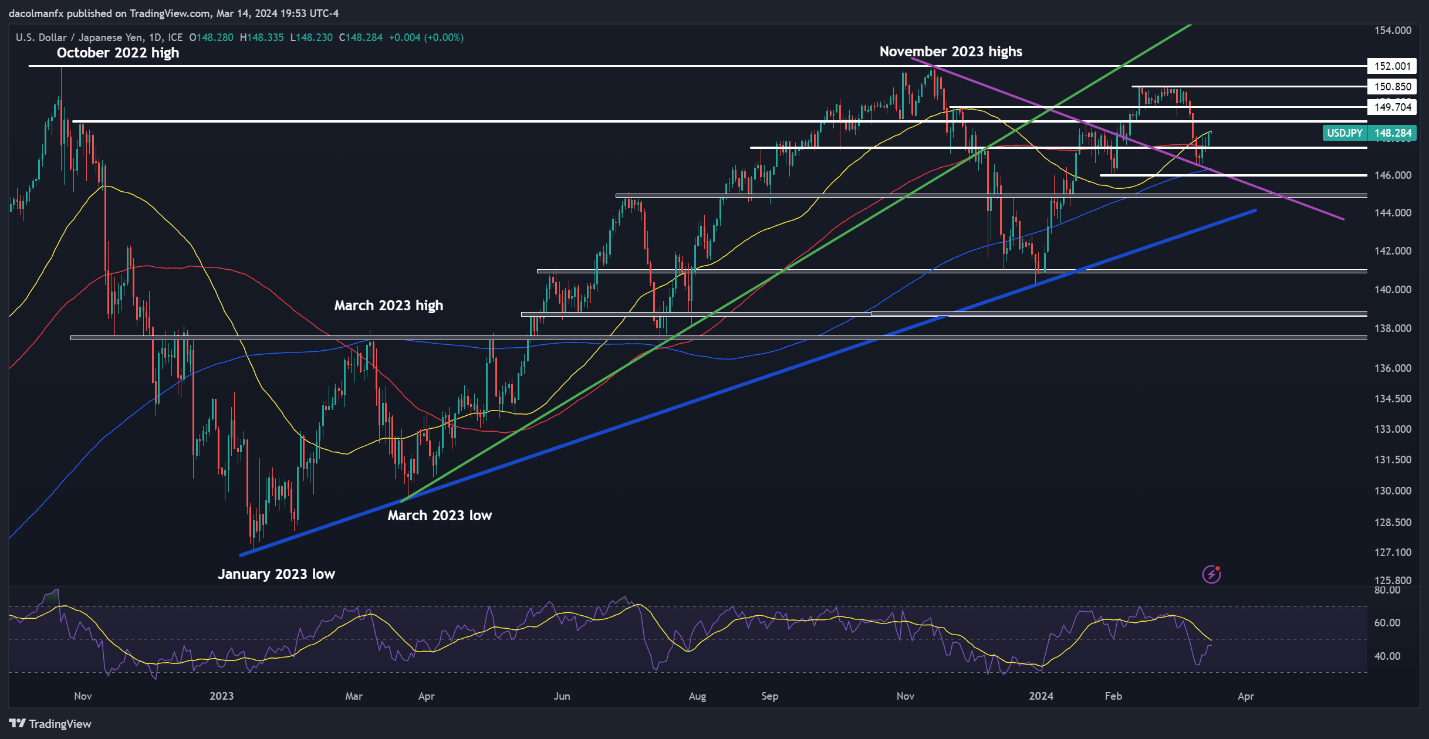
USD/JPY Chart Created Using TradingView
Interested in learning how retail positioning can offer clues about GBP/USD’s directional bias? Our sentiment guide contains valuable insights into market psychology as a trend indicator. Download it now!
| Change in | Longs | Shorts | OI |
| Daily | 11% | -16% | -4% |
| Weekly | 48% | -25% | 0% |
GBP/USD FORECAST – TECHNICAL ANALYSIS
GBP/USD continued to lose ground on Thursday, steadily approaching an important support zone near 1.2700. This area should provide stability in case of further losses, but a breakdown is likely to spark a retracement toward trendline support at 1.2665. Moving lower, attention will be on the 1.2600 handle.
Alternatively, if sentiment improves and cable mounts a turnaround, initial resistance appears at 1.2830, followed by 1.2895. Breaking through this barrier might pose a challenge for the bullish camp, although a successful breach could lead to a rally toward the psychological 1.3000 mark.
GBP/USD PRICE ACTION CHART
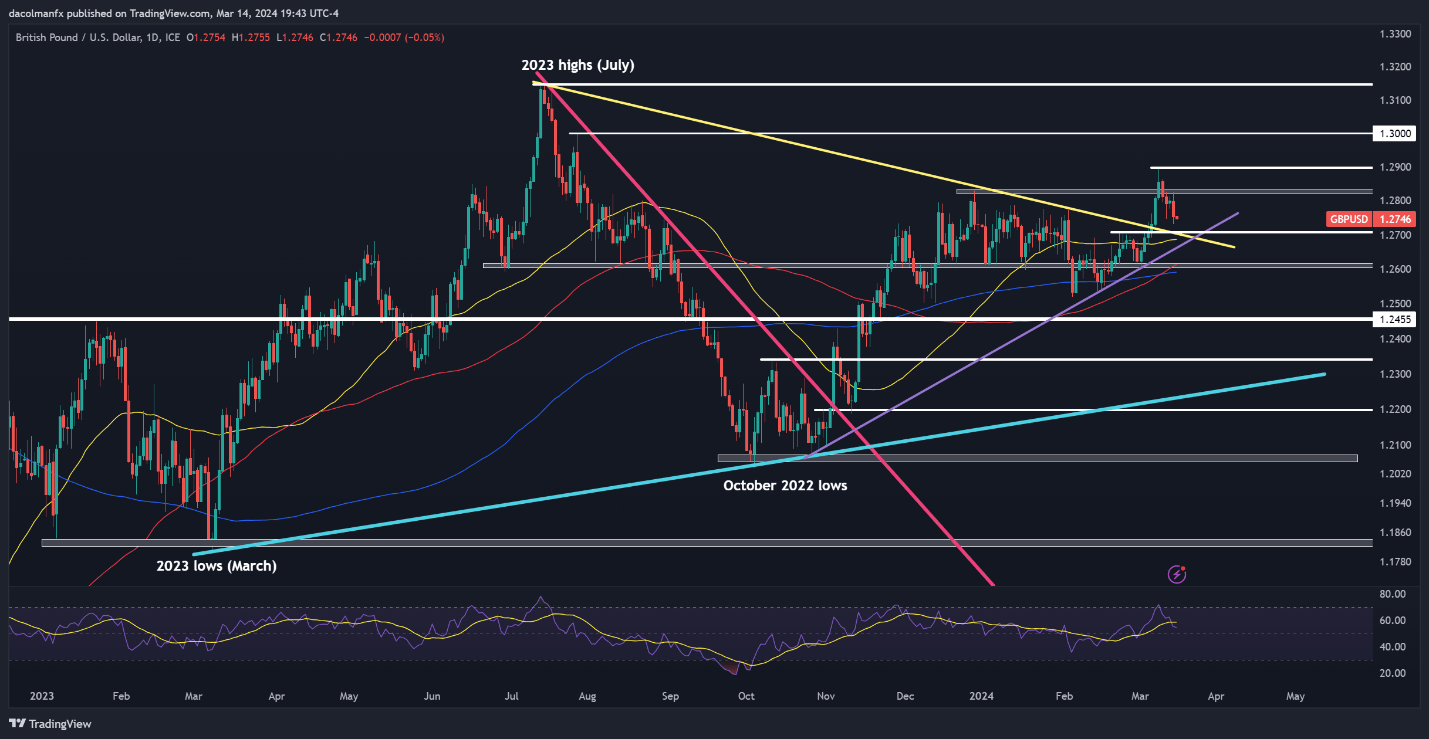
GBP/USD Chart Created Using TradingView