US Dollar Index Price and Analysis
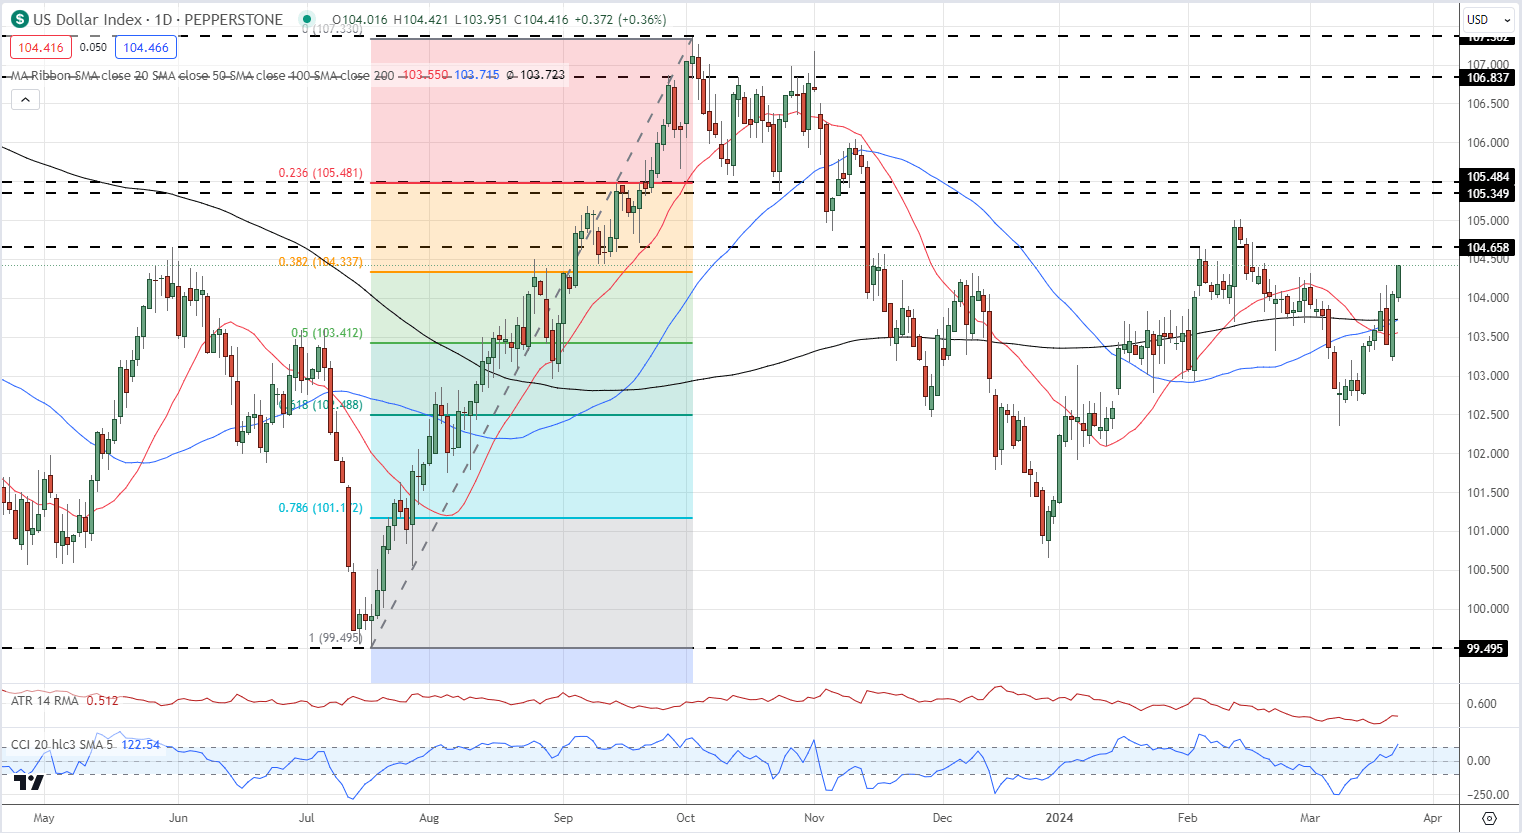
- US The dollar index prints a fresh one-month high.
- Sterling continues to re-price lower after Thursday’s dovish BoE meeting.
For all major central bank meeting dates, see the DailyFX Central Bank Calendar
Recommended by Nick Cawley
Traits of Successful Traders
The Bank of England looks set to join the Federal Reserve and the European Central Bank in lowering borrowing costs in June with a global rate-cutting cycle looking set to dominate financial markets over the coming months. The Swiss National Bank jumped the gun yesterday, unexpectedly cutting its borrowing rate by 25 basis points to 1.5%. The SNB added that it was also ready to act to prevent the Swiss Franc from any further appreciation if necessary. The weakening of a raft of major G7 currencies has given the US dollar index a boost higher.
Bank of England Leaves Rates Unchanged, Vote Split Turns Dovish, GBP/USD Slips
US Dollar Index Daily Price Chart
For all economic data releases and events see the DailyFX Economic Calendar
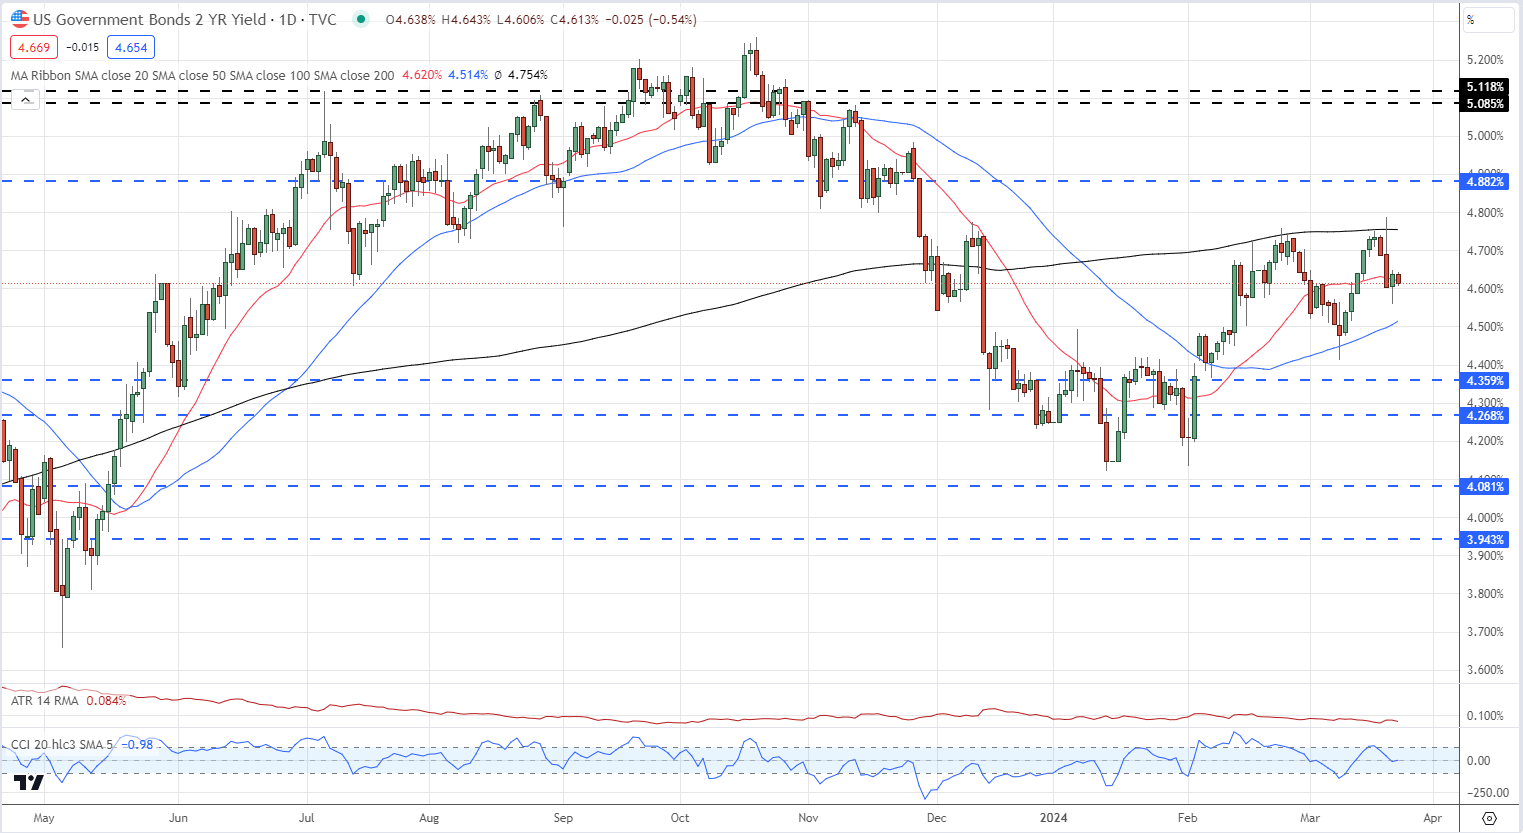
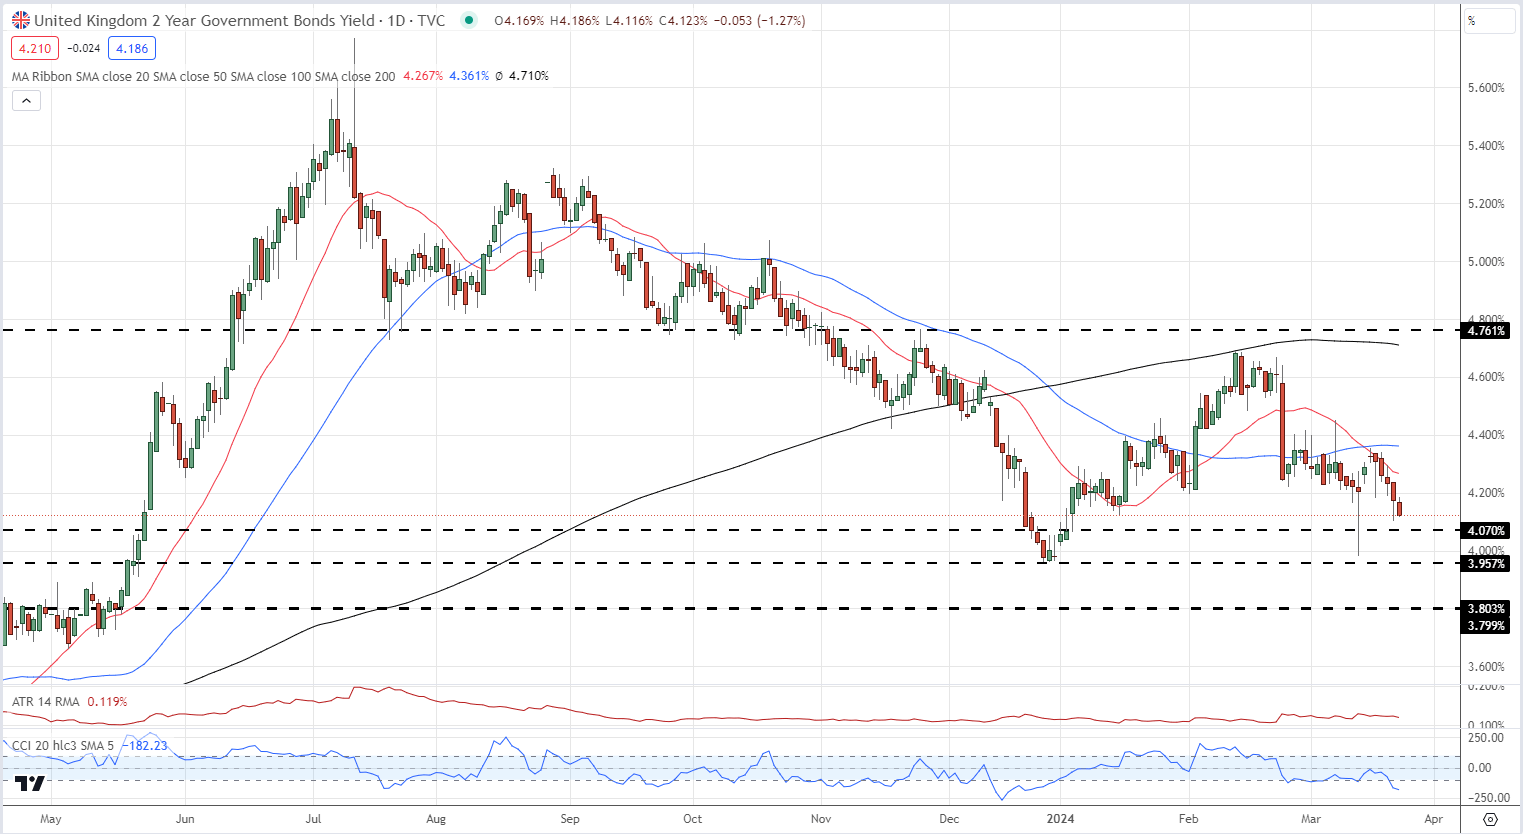
Short-dated US Treasury yields are little changed despite the greenback’s rally. In contrast, comparable Euro and UK 2-year bond yields continue to fall as markets continue to re-price recent central bank shifts.
US 2-Yr Bond Yields
UK 2-Yr Bond Yields
Learn how to trade GBP/USD with our complimentary guide
Recommended by Nick Cawley
How to Trade GBP/USD
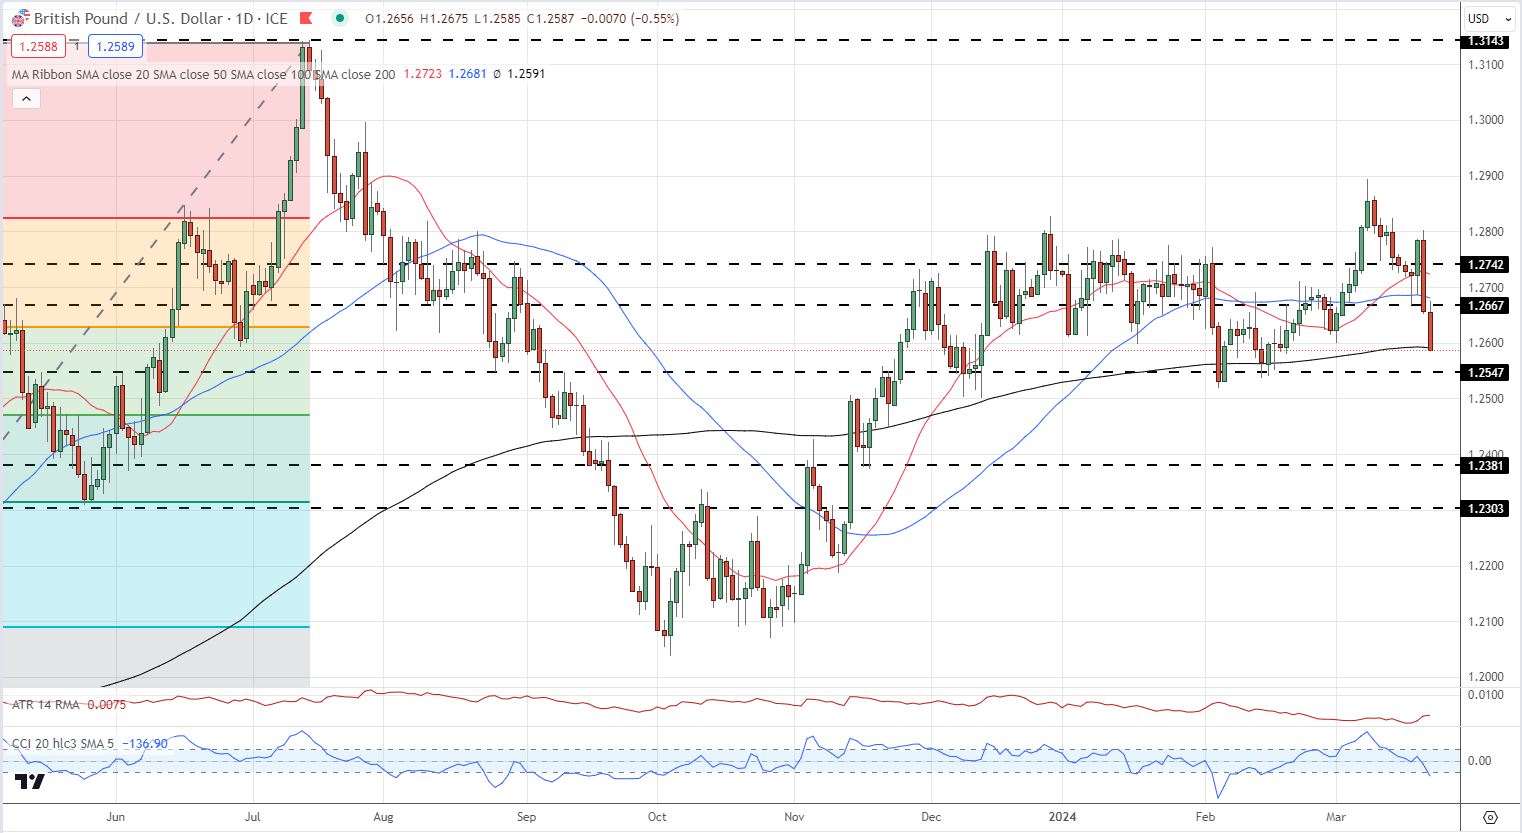
GBP/USD is trading at a one-month low in early European turnover with further losses likely. The pair now sit on the 200-day sma and a confirmed break below this technical indicator will bring 1.2547 and the 50% Fibonacci retracement level at 1.2471 into play. Below here 1.2381 comes into view. Any rebound will find resistance at 1.2628, the 38.2% Fib retracement, and 1.2667.
GBP/USD Daily Price Chart
All Charts via TradingView
Retail trader data shows 62.46% of traders are net-long with the ratio of traders long to short at 1.66 to 1.The number of traders net-long is 35.32% higher than yesterday and 13.48% higher than last week, while the number of traders net-short is 29.88% lower than yesterday and 25.16% lower than last week.
We typically take a contrarian view to crowd sentiment, and the fact traders are net-long suggests GBP/USD prices may continue to fall.
| Change in | Longs | Shorts | OI |
| Daily | 38% | -31% | 2% |
| Weekly | 14% | -29% | -7% |
What are your views on the US Dollar and the British Pound – bullish or bearish?? You can let us know via the form at the end of this piece or you can contact the author via Twitter @nickcawley1.