US Dollar and Gold Prices and Analysis
• US Treasury yields back at multi-month highs.
• US CPI and the latest FOMC minutes will drive the greenback’s next move.
• Gold driven higher by haven buying.
For all major central bank meeting dates, see the DailyFX Central Bank Calendar
Download our Brand New Q2 Gold Technical and Fundamental Forecasts
Recommended by Nick Cawley
Get Your Free Gold Forecast
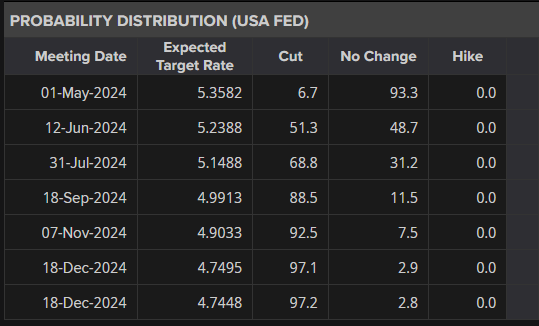
The US dollar remains better bid in early European trade, underpinned by higher US Treasury yields. Last Friday’s strong NFPs – 303k vs. 200k expectations – helped to trim market expectations of a June rate cut. Financial markets have for weeks been pricing in a cut by the FOMC on June 12th, but this is now seen as a coin toss as expectations are pared back further.
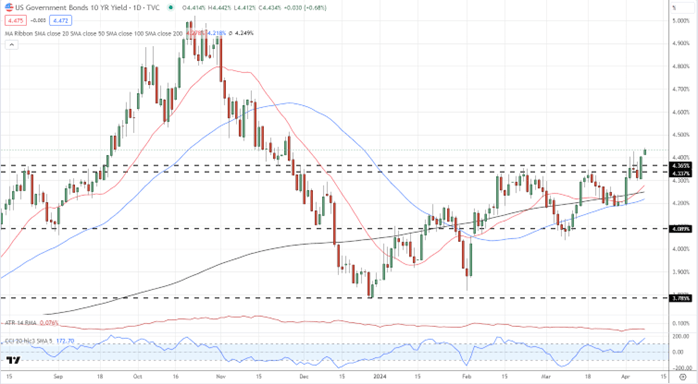
US Treasury yields rose after the Jobs Report and are building on Friday’s gains. The interest-rate sensitive US 2-yr now yields 4.77% and is within a couple of basis points of highs last seen in mid-November, while the benchmark US 10-yr has broken above a range of resistance and is trading at a multi-month high of 4.475%.
US NFPs Trump Expectations, US Dollar Grabs a Bid, Gold Slips But Retains Haven Support
10-Yr US Treasury Yield Daily Chart
US dollar drivers this week include Core inflation (March) and the latest FOMC minutes, both released on Wednesday.
For all economic data releases and events see the DailyFX Economic Calendar
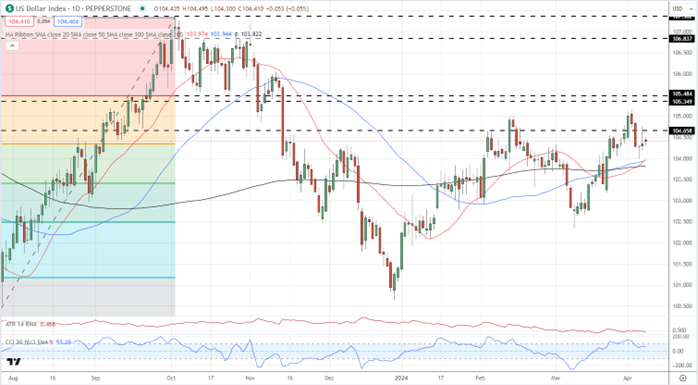
The US dollar index is currently sitting on the 38.2% Fibonacci retracement level around 104.35 and is supported by a cluster of three simple moving averages. These SMAs supported the index last Thursday and a bullish 50-day/200-day crossover made in late March provides additional support to the move higher.
The Golden Cross – What Is It And How To Identify It When Trading
US Dollar Index Daily Chart
Gold Price Weekly Forecast – Fresh Record Highs on Heightened Israel/Iran Fears
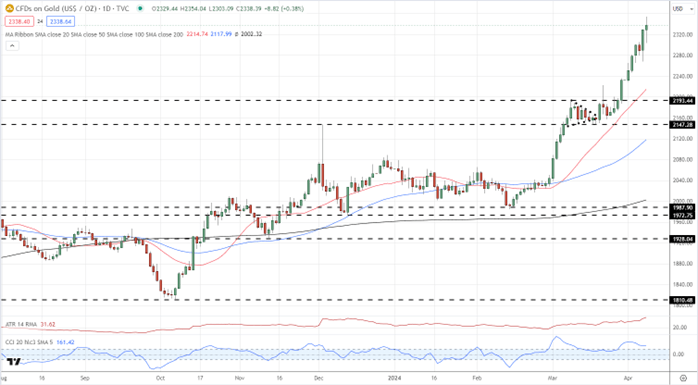
Gold continues to print fresh record highs as geopolitical fears fuel a strong haven bid. Escalating tensions between Israel and Iran have pushed gold to fresh record highs in recent days and with the situation between the two countries unlikely to be resolved shortly, gold will remain in demand.
Recommended by Nick Cawley
How to Trade Gold
Gold Daily Price Chart
All Charts via TradingView
Retail trader data shows 42.79% of traders are net-long with the ratio of traders short to long at 1.34 to 1. The number of traders net-long is 0.49% higher than yesterday and 0.93% lower than last week, while the number of traders net-short is 2.35% lower than yesterday and 1.91% higher from last week.
We typically take a contrarian view to crowd sentiment, and the fact traders are net-short suggests Gold prices may continue to rise.
| Change in | Longs | Shorts | OI |
| Daily | 0% | -1% | -1% |
| Weekly | -3% | 3% | 0% |
What are your views on the US Dollar – bullish or bearish?? You can let us know via the form at the end of this piece or you can contact the author via Twitter @nickcawley1.