Most Read: U.S. Dollar Outlook & Market Sentiment: USD/JPY, USD/CAD, USD/CHF
The U.S. dollar, as measured by the DXY index, strengthened this past week, closing at its best level since mid-February on Friday. Despite initial losses following the Fed’s dismissal of renewed inflation risks and indications that it was still on track for 75 basis points of easing this year, the greenback reversed higher in the next two days amid a global shift in interest rate expectations.
US DOLLAR INDEX WEEKLY CHART
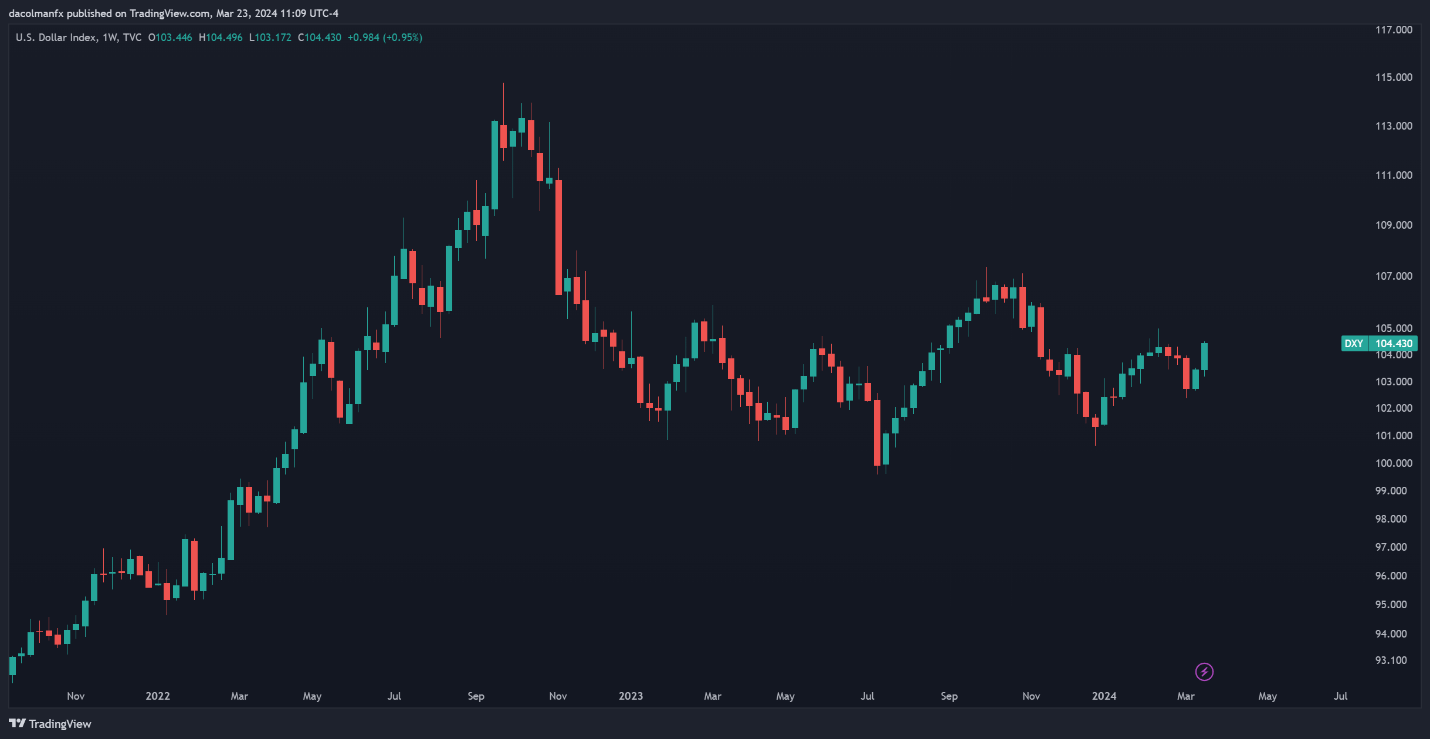
Source: TradingView
The Bank of England’s dovish posture during its March meeting, coupled with the Swiss National Bank’s unexpected rate cut, fueled speculation that other key central banks might relax their policies earlier than the FOMC, given the more fragile state of their respective economies. The European Central Bank, for example, could be one of them.
Eager to discover what the future holds for the U.S. dollar? Delve into our quarterly forecast for expert insights. Get your complimentary copy now!
Recommended by Diego Colman
Get Your Free USD Forecast
Looking ahead to potential catalysts, next week’s highlight on the U.S. economic calendar will be the release of the core PCE deflator, the Fed’s favorite inflation gauge. With many international markets shuttered for Good Friday, the true reaction to the data might not be entirely evident until Monday. Despite this, volatility could still make an appearance due to thinner liquidity conditions.
Focusing on the upcoming PCE report, the core price index indicator is forecast to have risen 0.3% m-o-m in February, leaving the 12-month reading unchanged at 2.8%. Any result above this estimate should be bullish for the dollar, as it could force the U.S. policymakers to wait a bit longer before pivoting to a looser stance.
UPCOMING US PCE DATA
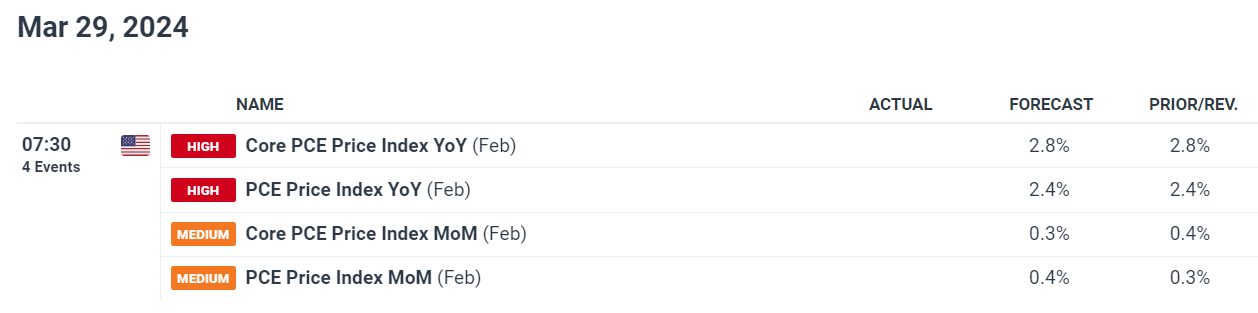
Source: DailyFX Economic Calendar
Want to know where EUR/USD may headed over the coming months? Explore all the insights available in our quarterly forecast. Request your complimentary guide today!
Recommended by Diego Colman
Get Your Free EUR Forecast
EUR/USD FORECAST – TECHNICAL ANALYSIS
EUR/USD has fallen sharply in recent days, breaching both trendline support and the 200-day simple moving average at 1.0835, signaling a bearish shift. If losses accelerate in the coming week, a key technical floor to watch emerges at 1.0800. Below this area, the focus will be on 1.0725.
On the other hand, if bulls mount a comeback and spark a rebound, resistance can be identified in the 1.0835-1.0850 band. In the event of a bullish push past this range, attention will be directed towards the 100-day simple moving average, followed by 1.0890 and 1.0925 in case of sustained strength.
EUR/USD PRICE ACTION CHART
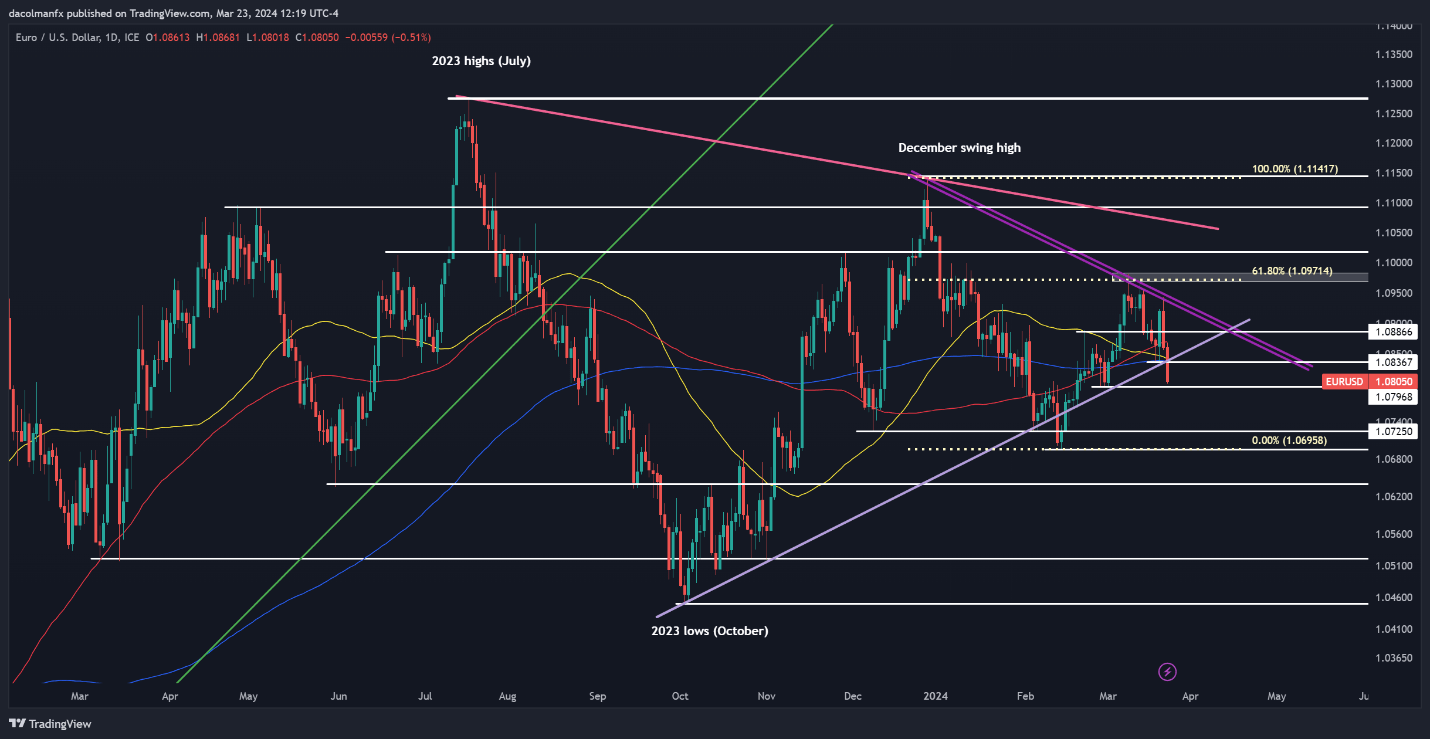
EUR/USD Chart Created Using TradingView
Curious about what lies ahead for USD/JPY? Find comprehensive answers in our quarterly trading forecast. Claim your free copy now!
Recommended by Diego Colman
Get Your Free JPY Forecast
USD/JPY FORECAST – TECHNICAL ANALYSIS
USD/JPY jumped this week, coming within striking distance from retesting its 2023 peak near 152.00. A breach of this resistance could prompt Japanese authorities to step in to support the yen, so gains may not be sustained. Without FX intervention, however, a breakout could usher in a move towards 154.40.
On the flip side, if sellers return and manage to drive prices lower, technical support looms at 150.90 and 149.75 thereafter. The pair could stabilize around these levels during a pullback, but in the event of a breakout, a drop towards the 50-day simple moving average at 148.90 cannot be ruled out.
USD/JPY PRICE ACTION CHART
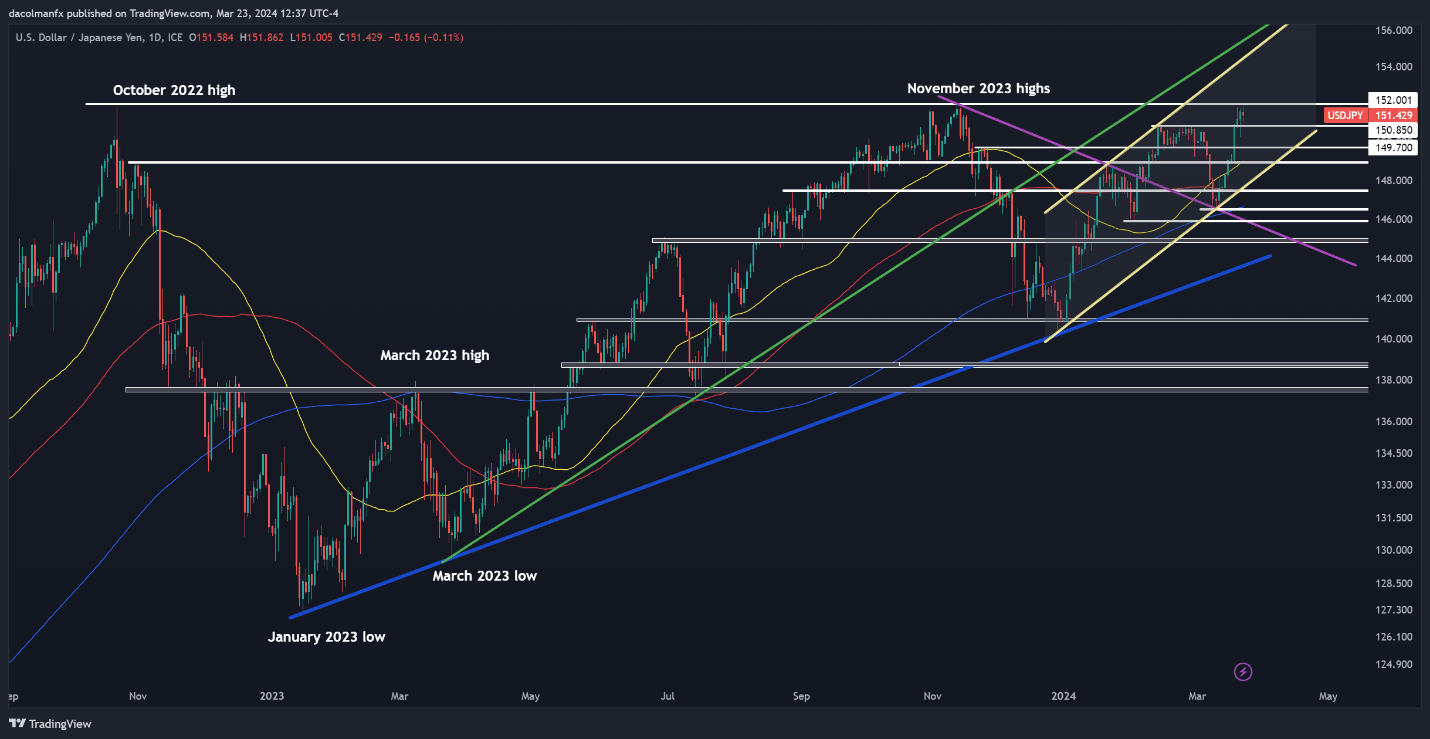
USD/JPY Chart Created Using TradingView
Interested in learning how retail positioning can offer clues about GBP/USD’s directional bias? Our sentiment guide contains valuable insights into market psychology as a trend indicator. Download it now!
| Change in | Longs | Shorts | OI |
| Daily | 8% | -9% | 1% |
| Weekly | 25% | -28% | 0% |
GBP/USD FORECAST – TECHNICAL ANALYSIS
GBP/USD plunged this week, breaching major levels in the process, including 1.2700, the 50-day simple moving average and a key trendline at 1.2675. Should losses continue in the near term, particular focus should be placed on the 200-day SMA at 1.2600, as a break below it may trigger a drop towards 1.2520.
Conversely, in a scenario where sentiment brightens and cable stages a reversal, resistance thresholds can be pinpointed at 1.2675 and 1.2700 thereafter. Bulls may have a hard time taking out these barriers, yet if they manage to invalidate them, there would be little standing in the way of reclaiming the 1.2800 mark.
GBP/USD PRICE ACTION CHART
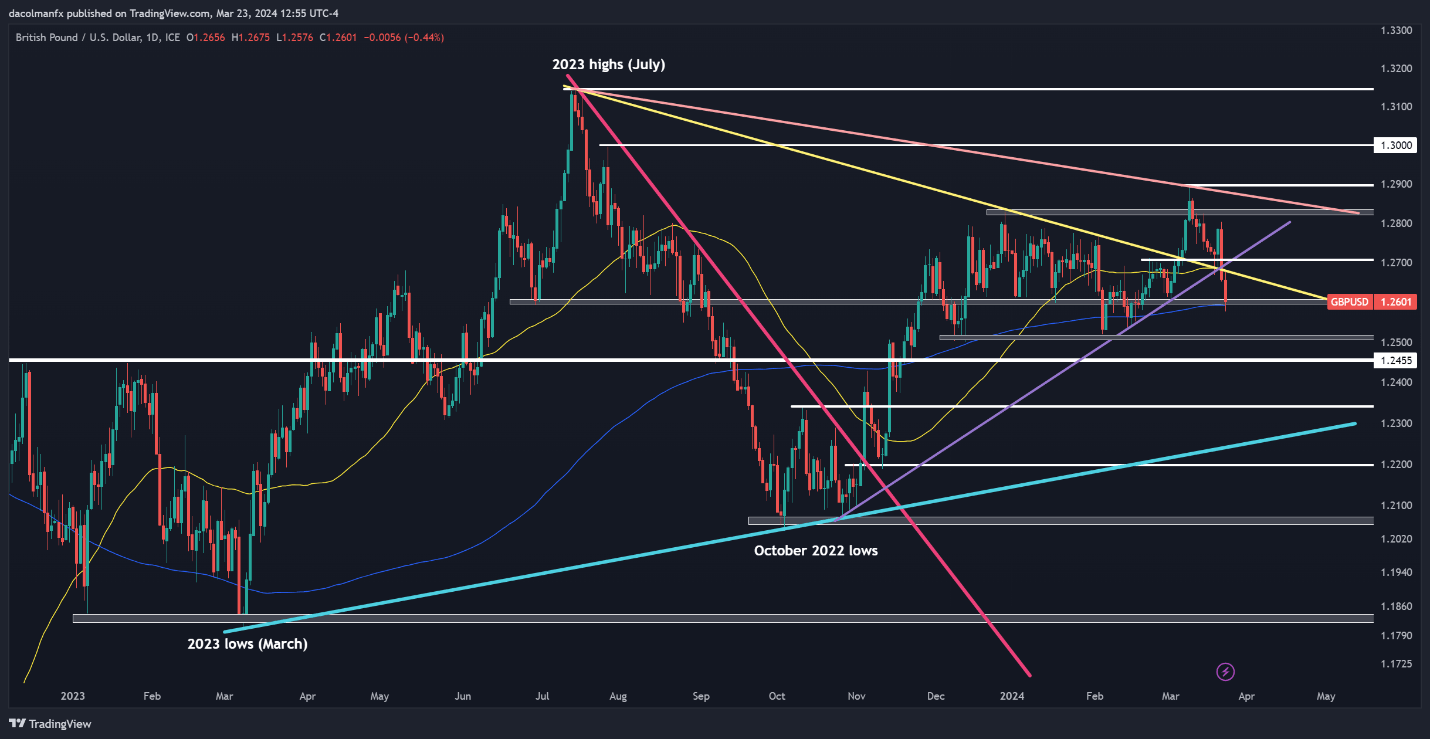
GBP/USD Chart Created Using TradingView