Article by IG Senior Market Analyst Axel Rudolph
FTSE 100, DAX 40, and S&P 500 Analysis and Charts
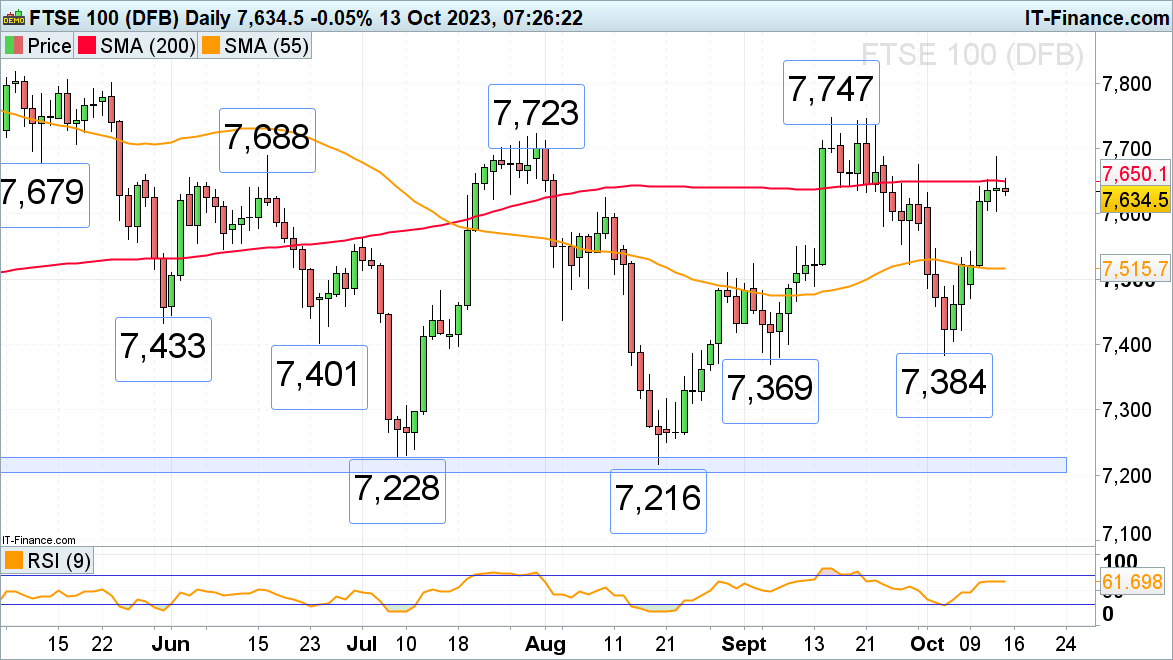
FTSE 100 capped by resistance
The FTSE 100 has seen six consecutive days of gains, on Thursday driven by energy and health care stocks, but has come off the 200-day simple moving average (SMA) at 7,650 as US CPI inflation came in slightly higher-than-expected and provoked a reversal lower. Further consolidation below Thursday’s high at 7,687 is expected to be seen on Friday. If a slip through Thursday’s low at 7,604 were to unfold, support between the 7,562 early July high and the 7,550 11 September high may be revisited.
This week’s high at 7,687 ties in with the mid-June high at 7,688. Further up lie the July and September highs at 7,723 to 7,747.
FTSE 100 Daily Chart
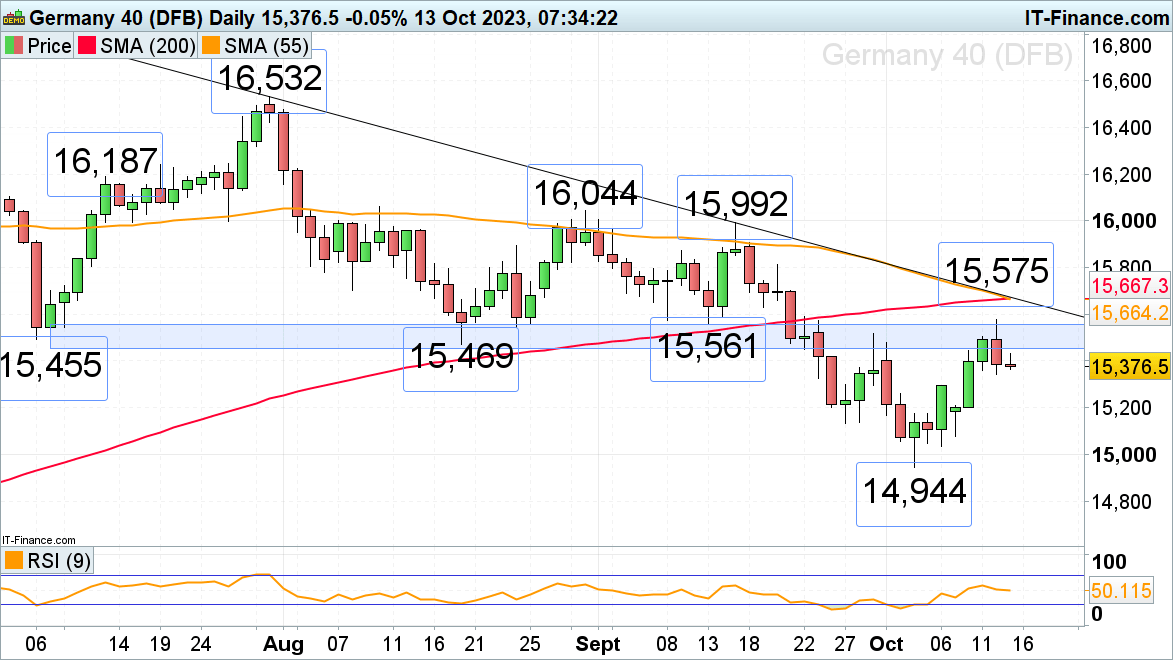
DAX 40 rally stalls within resistance area
The DAX 40 rallied into its major 15,455 to 15,561 resistance area, made up of the July to mid-September lows, and even briefly rose slightly above it on Thursday to 15,575 before heading back down again on the second straight monthly upward surprise in US inflation.A drop back towards last Friday’s high at 15,296 may now ensue. Further down lies minor support at last Tuesday’s 15,259 high.
Were a rise and daily chart close above this week’s 15,575 high to be made, the 200- and 55-day simple moving averages as well as the July-to-October downtrend line at 15,664 to 15,676 would be in sight.
DAX 40 Daily Chart
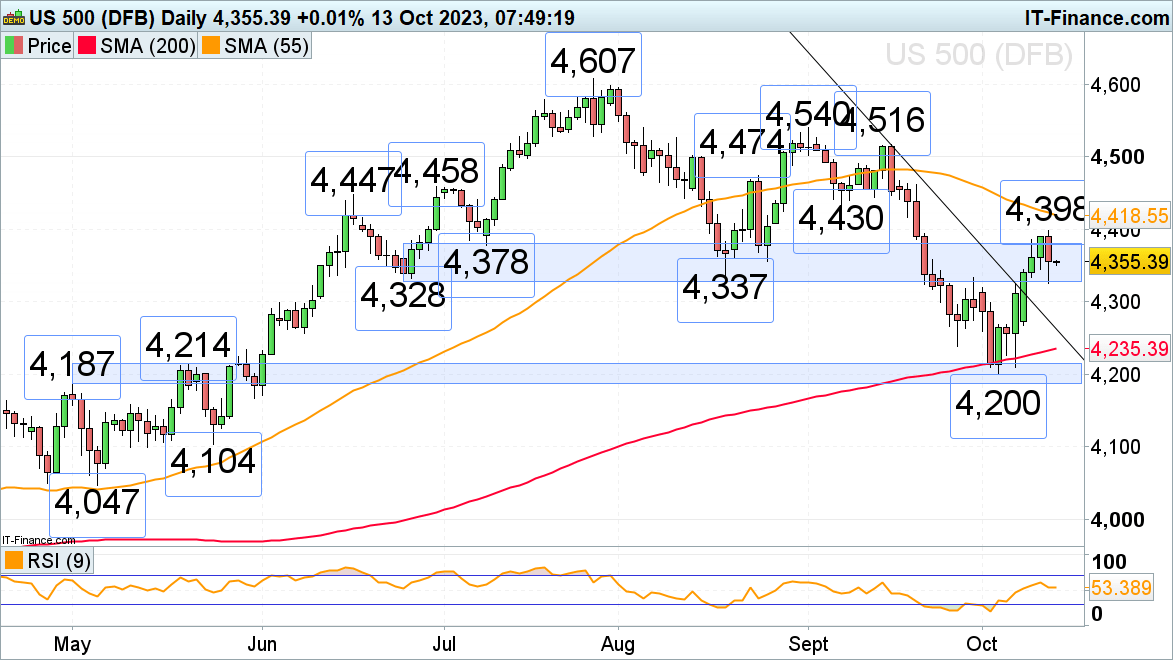
S&P 500 slips back into the 4,328 to 4,378 resistance area
The S&P 500 has re-entered its 4,328 to 4,378 resistance area, made up of the late June to August lows and late September high, having briefly overcome it on Wednesday and Thursday by rising to 4,398 before coming off again as US CPI inflation came in slightly higher-than-expected at 3.7%. The index did find support around the lower end of the previous resistance area at 4,325, though. Were this level to give way, the early June high at 4,299 could be revisited.
Were a rise above this week’s high at 4,398 to be seen, the 55-day simple moving average (SMA) at 4,218 would be next in line.
S&P 500 Daily Chart