EUR/USD News and Analysis
- ECB member favours multiple rate cuts ahead of the summer
- EUR/USD flirts with familiar zone of resistance
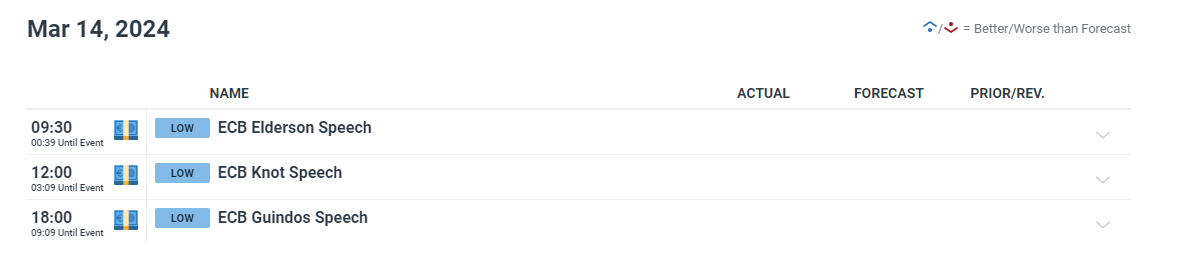
- More ECB speakers scheduled today as event risk quietens down
- The analysis in this article makes use of chart patterns and key support and resistance levels. For more information visit our comprehensive education library
Recommended by Richard Snow
How to Trade EUR/USD
ECB Member Favours Multiple Rate Cuts Ahead of the Summer
The Greek central bank head, Yannis Stournaras (dove) mentioned in an interview this morning that there remains around 30% of past tightening yet to filter into the real economy, stressing the need to move the needle on rates ahead of the Fed.
The European economy has stagnated since Q4 2024, with GDP growth oscillating around zero percent while the US shows remarkable economic resilience. Therefore, there is some logic behind the recent call to ease monetary policy in an attempt to support the ailing economy.
Stournaras went as far as to advocate for two cuts before the summer break which means a total of 50 basis points shaved off the current benchmark interest rate. The ECB official warned against exaggerating the potential for a wage-price spiral as Christie Lagarde and other governing council members turned their focus on wage negotiations and the potential for higher wages adding to inflation concerns.
Immediate Market Reaction
EUR/USD dropped as Stournaras’ statements filtered appeared across trading monitors, but the pair managed to stabilise moments after.
EUR/USD 5-Minute Chart
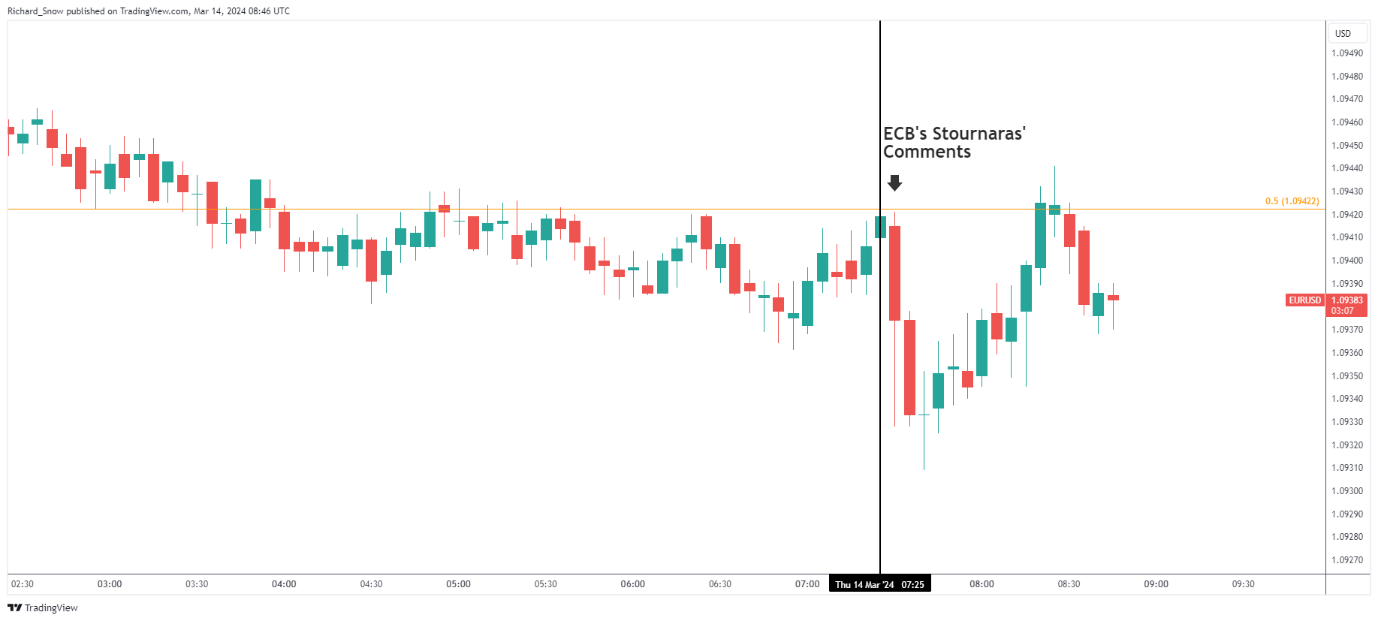
Source: TradingView, prepared by Richard Snow
EUR/USD Flirts with Familiar Zone of Resistance
The weekly EUR/USD chart shows the pair struggling for bullish momentum around the 1.0930/1.0940 zone that had sent prices lower on multiple occasions in 2023. This week is rather light as far as the economic calendar is concerned meaning consolidation around current levels may continue. Notable US data includes PPI and retail sales later today with tomorrow’s University of Michigan consumer sentiment survey able to provide limited volatility into the end of the week depending on whether inflation expectations are much changed.
EUR/USD Weekly Chart
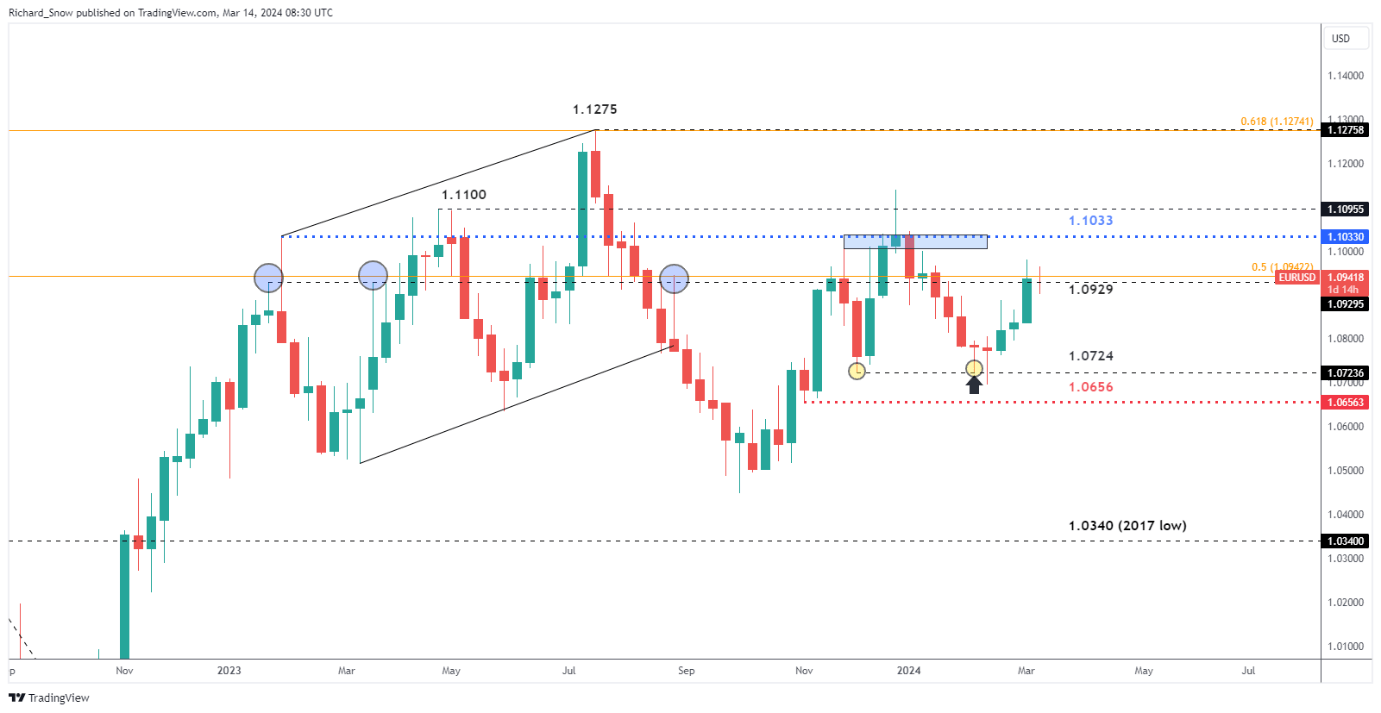
Source: TradingView, prepared by Richard Snow
The daily chart highlights the resistance zone as the area between the two Fibonacci retracements which are made up of the 2020 to 2022 major decline and the 2023 decline. The levels of interest correspond to the 50% and 61.8% retracements of the respective, implied Fibonacci projections.
Price action remains above the 50 and 200-day simple moving averages (SMAs) – which is typically bullish. However, price momentum appears to be stalling and the 50 SMA reveals as much, dropping lower towards the 200 SMA. Should the bullish move continue, a break above 1.0960 will be required with subsequent momentum, eying 1.1017.
EUR/USD Daily Chart
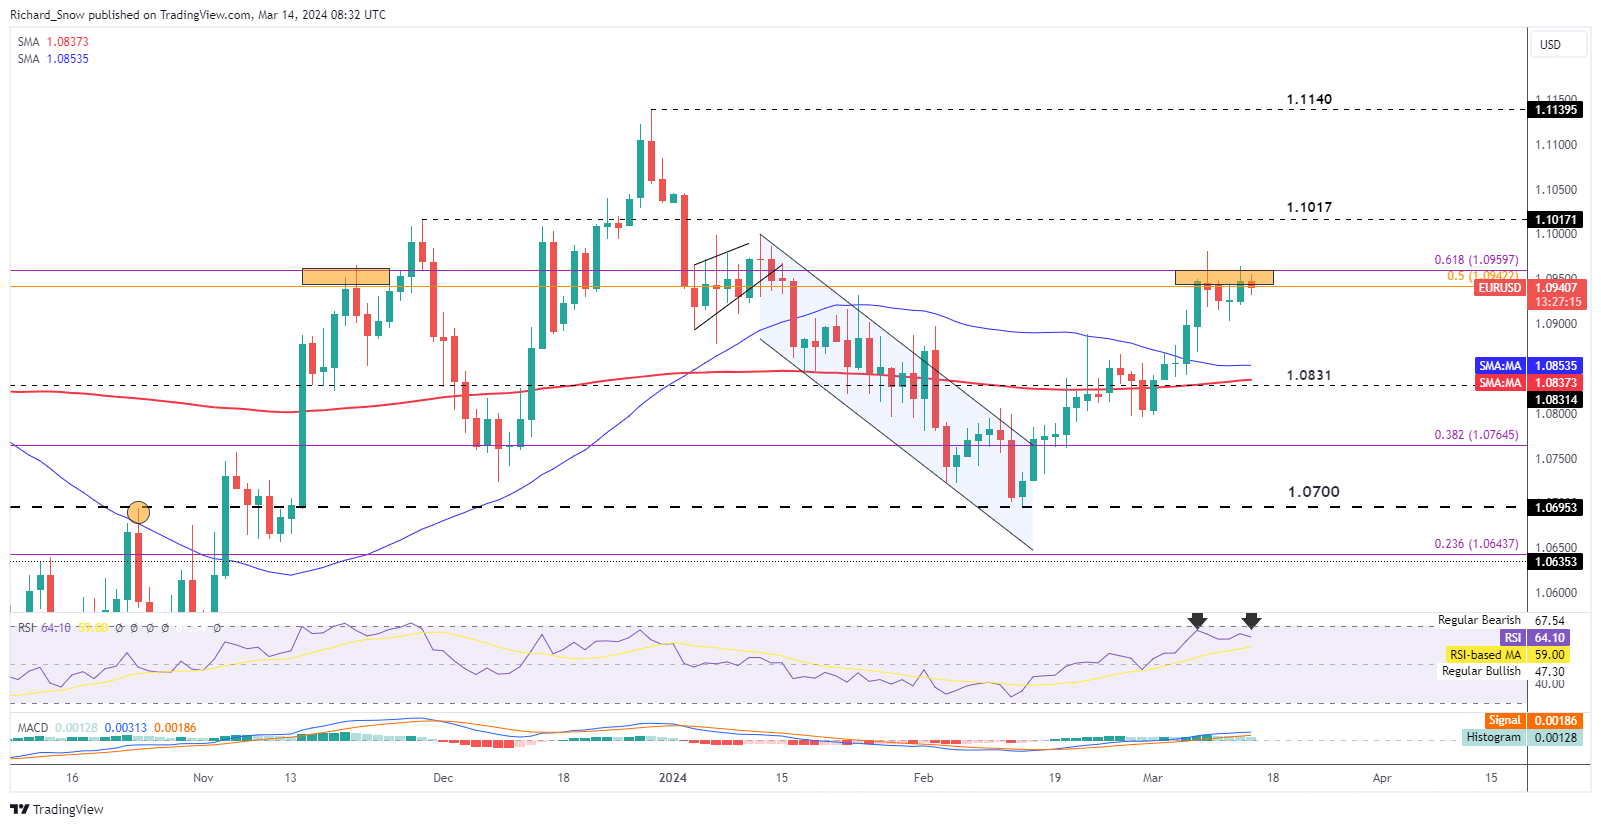
Source: TradingView, prepared by Richard Snow
Stay up to date with the latest market moves and themes driving price action by signing up to our weekly newsletter:
Trade Smarter – Sign up for the DailyFX Newsletter
Receive timely and compelling market commentary from the DailyFX team
Subscribe to Newsletter
Keep an eye out for any further support of this view as a number of other governing council members are due to provide their thoughts on monetary policy later today.
Customize and filter live economic data via our DailyFX economic calendar
— Written by Richard Snow for DailyFX.com
Contact and follow Richard on Twitter: @RichardSnowFX