Most Read: Euro’s Outlook Darkens on Dovish ECB, Geopolitical Risks – EUR/USD, EUR/GBP
Gold advanced this week, but ended the five-day period off its best levels established briefly on Friday during the New York session, when it touched $2,430, a fresh record. Considering recent performance, the precious metal has increased in seven of the last eight weeks, rallying more than 17% since mid-February and shrugging off extremely overbought conditions.
These gains have occurred despite the strength of the U.S. dollar and the hawkish repricing of U.S. interest rate expectations in light of resilient economic activity and sticky CPI readings. In the process, the typical negative relationship between bullion and U.S. real yields has broken down, as shown in the chart below, puzzling fundamental traders.
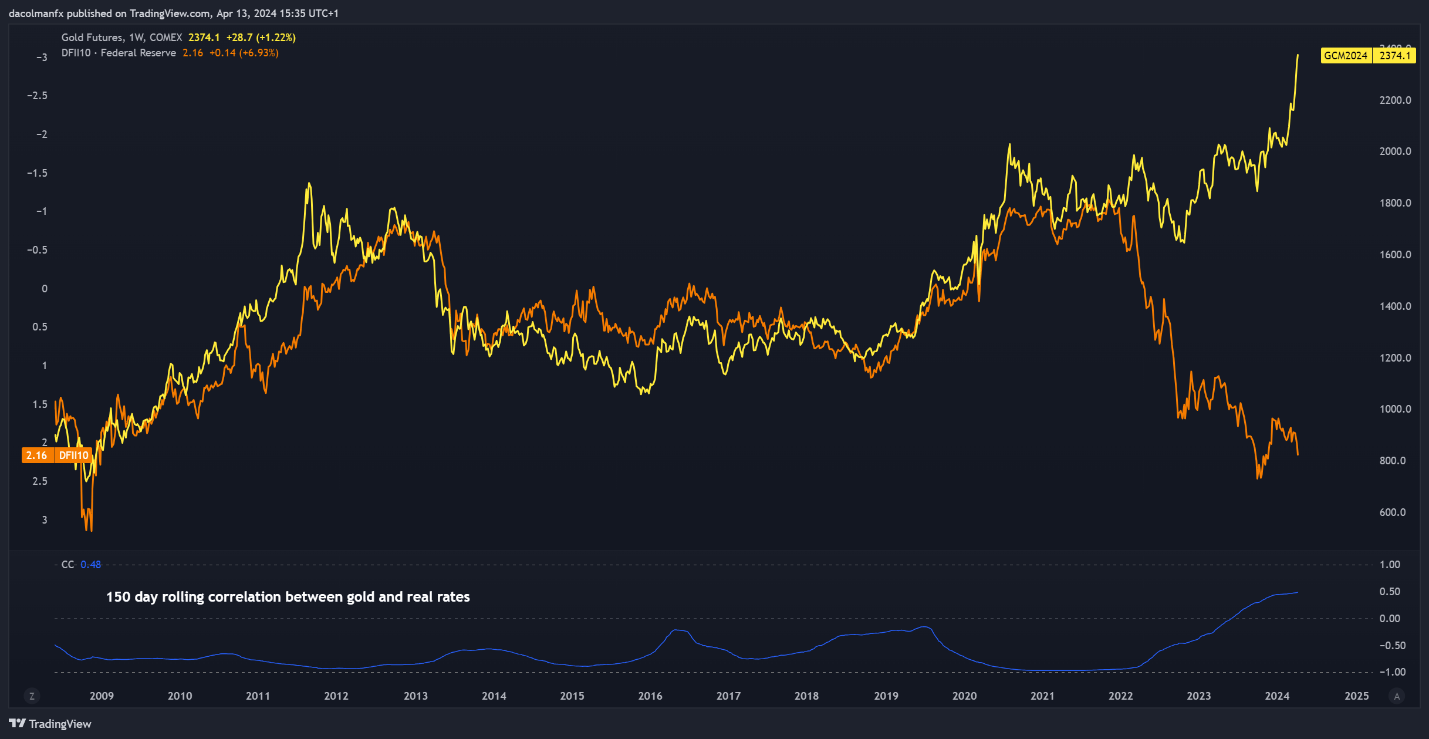
Source: TradingView
Geopolitical frictions in the Middle East have further bolstered gold, although these risks have intensified only recently and haven’t been a predominant theme for an extended period. To add context, investors have been nervous about Iran’s potential retaliation against Israel following the bombing of its embassy in Syria. Such action could escalate tensions in the region and spill over into a wider conflict.
For an extensive analysis of gold’s fundamental and technical outlook, download our complimentary quarterly trading forecast now!
Recommended by Diego Colman
Get Your Free Gold Forecast
Deeper Look into Current Market Drivers
There are several other reasons that could explain why gold has done so well this year. Here are some possible explanations for its ascent:
The Momentum Trap: Gold’s relentless rise could be fueled by a self-fulfilling speculative frenzy. This trend-following behavior can create vertical rallies that are often unsustainable over the long term. Should this dynamic be at play right now, a sharp downward correction could unfold once sentiment shifts and valuations reset.
Hard landing: Some market participants may be hedging an economic downturn caused by the aggressive monetary policy tightening from 2022-2023 and the fact that policymakers could keep interest rates higher for longer in response to stalling progress on disinflation.
Inflation comeback: Gold bulls could be taking a strategic long-term approach, betting that the Fed will cut rates no matter what as insurance policy to prevent adverse developments in an election year. Cutting rates while consumer prices remain well above the 2% target risks triggering a new inflationary wave that would ultimately benefit precious metals.
While all scenarios are plausible, the momentum-driven explanation feels most compelling. Throughout history, we’ve witnessed numerous occasions where popular assets have succumbed to speculative fervor, driving prices to unsustainable levels detached from fundamental before an eventual reversal once sentiment finally shifts. This fate may await gold, though the timing remains uncertain.
Interested in learning how retail positioning can shape the short-term trajectory of gold prices? Our sentiment guide has the information you need—download it now!
| Change in | Longs | Shorts | OI |
| Daily | -10% | -13% | -11% |
| Weekly | 11% | -17% | -6% |
GOLD PRICE TECHNICAL ANALYSIS
Gold climbed this week, setting a new all-time high near $2,430. However, prices eventually backed off those levels, closing at $2,344 on Friday. If the reversal extends in the coming trading sessions, support appears at $2,305, followed by $2,260. On further weakness, all eyes will be on $2,225.
On the flip side, if XAU/USD pivots higher and charges upward again, the $2,430 record high will be the first line of defense against further advances. With markets stretched and in overbought territory, gold may struggle to clear this barrier, but in the event of a breakout, we could see a move towards $2,500.
GOLD PRICE TECHNICAL CHART
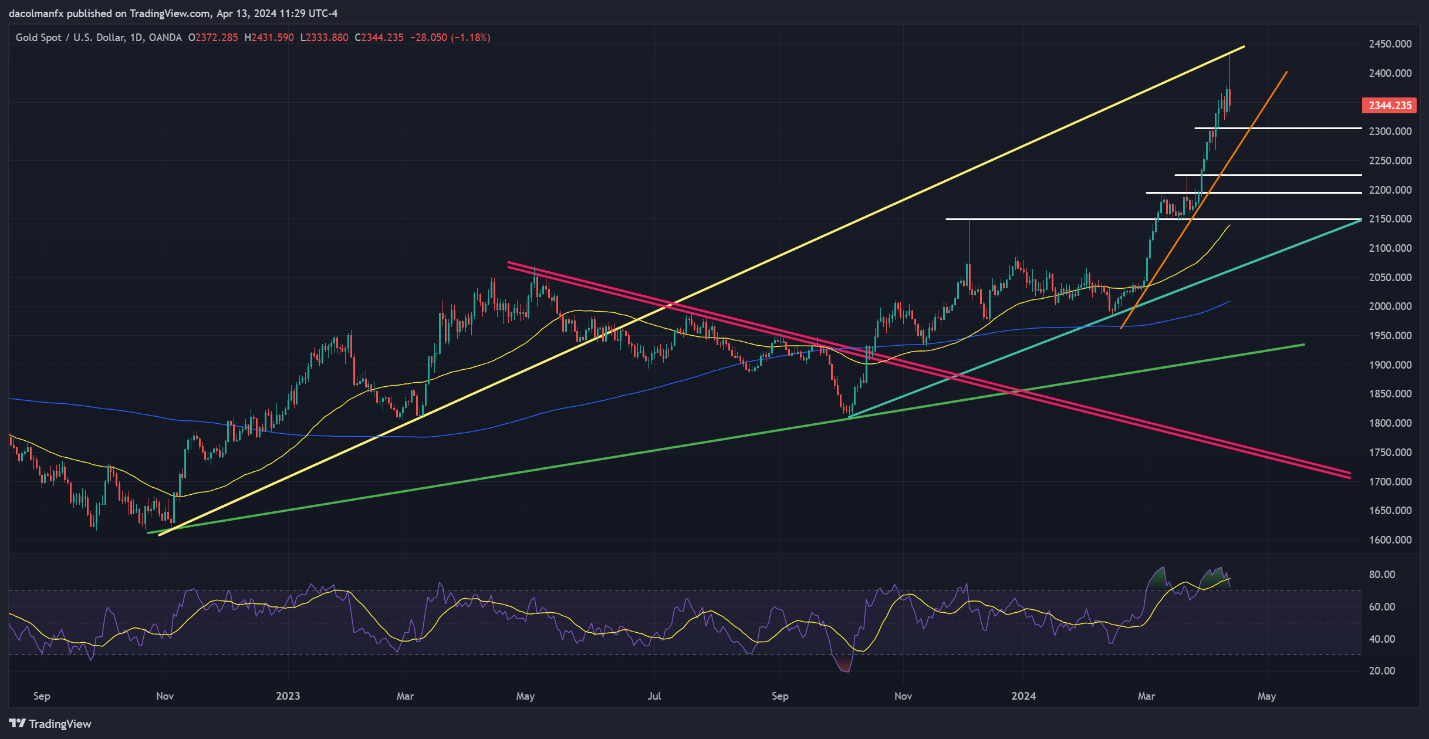
Gold Price Chart Created Using TradingView