Bitcoin (BTC), Ethereum (ETH) – Prices, Charts, and Analysis:
- Bitcoin posts a fresh all-time high.
- Ethereum continues to rally but still lags Bitcoin.
Recommended by Nick Cawley
Get Your Free Introduction To Cryptocurrency Trading
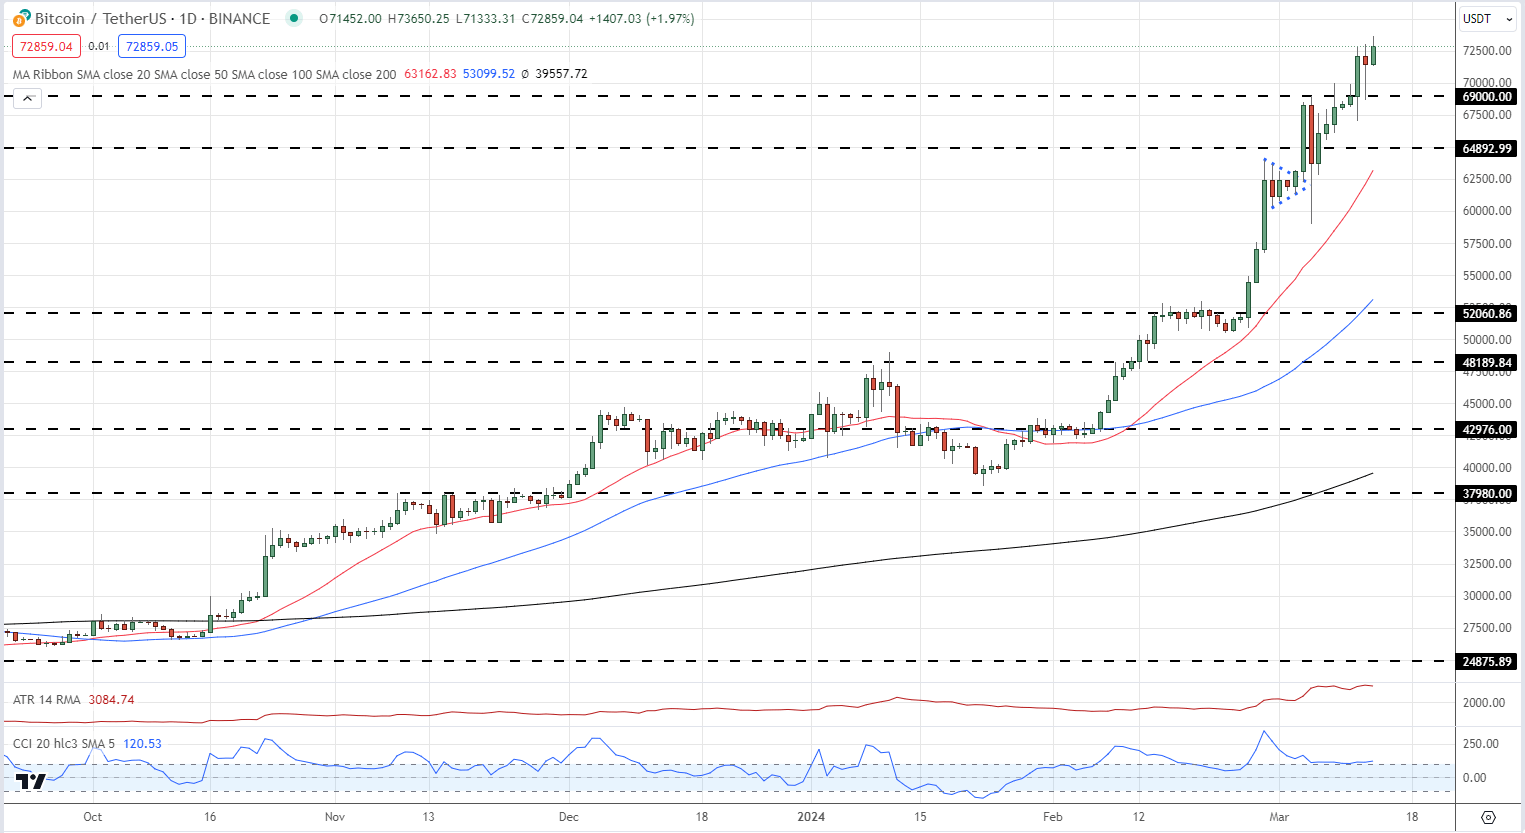
Bitcoin continues to press higher, making fresh all-time highs in the process. The largest cryptocurrency by market capitalization is up just over 92% since the January 23 swing low ($38.55k), with the move higher driven by ongoing spot ETF buying. Blackrock, the world’s largest asset manager, now holds approximately 204k Bitcoin – current value $14.97 billion – despite their spot ETF being less than two months old. This holding is just behind MicroStrategy’s Michael Saylor who currently holds 205k BTC at an average cost price of around $33.7k.
Bitcoin Halving Event
While ETF demand remains the prominent driver of Bitcoin activity, the markets continue to price in next month’s BTC halving event where mining rewards will be slashed by 50%. The ongoing demand-new supply mismatch (demand outstripping supply) continues to underpin the move higher. Any short-term sell-off, normally attributed to leveraged longs bailing, is normally bought back on the same day, highlighting and reinforcing the strength of the recent move higher. While demand for spot Bitcoin ETFs may weaken, the supply-side dynamic will keep BTC moving higher over the weeks ahead.
Bitcoin Daily Price Chart
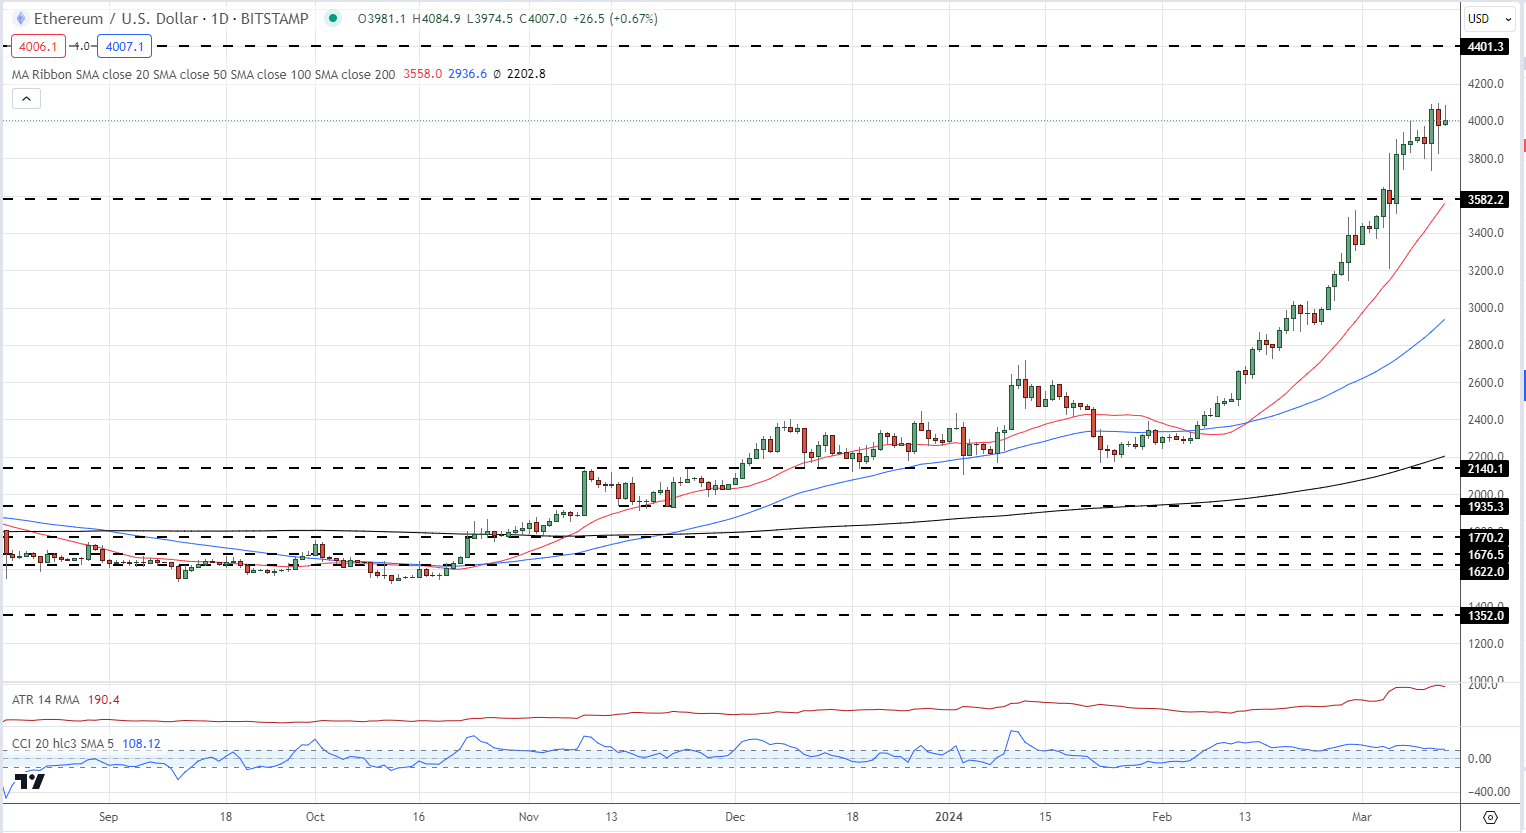
Ethereum has neither the ETF-demand pull of the upcoming supply shock so is understandably lagging Bitcoin at the moment. The first spot Ethereum ETF is up for final review by the SEC on May 23rd and while there is a possibility that this ETF and most probably all the others, is/are approved, the short-term outlook looks unlikely. This lag – Ethereum spot ETFs are very likely to be approved this year – will keep Ethereum underperforming Bitcoin over the coming weeks, unless the SEC looks to accelerate the approval process. The daily chart shows Ethereum running into short-term resistance around $4.1k. If/when this level is broken, the move to the next level of resistance at $4.4k may be swift.
Ethereum Daily Price Chart
Ethereum Spot ETF – The Next Cab Off the Rank?
All charts via TradingView
What is your view on Bitcoin, Ethereum – bullish or bearish?? You can let us know via the form at the end of this piece or you can contact the author via Twitter @nickcawley1.