Article by IG Chief Market Analyst Chris Beauchamp
Dow Jones, Nikkei 225, and CAC 40 Analysis and Charts
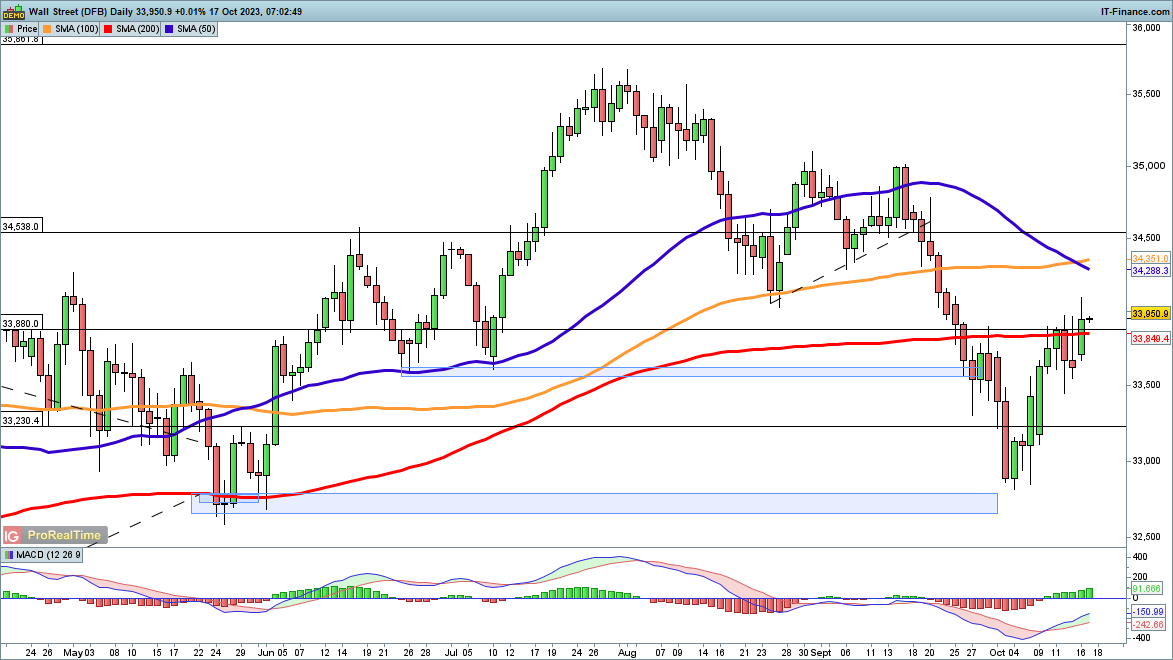
Dow targets 34,000
The index moved back above the 200-day simple moving average (SMA) on Monday, something that has eluded it since the second half of September. Monday’s session marked the revival of the move higher from the beginning of October, and a close above 34,000 could put the rally on a more secure footing. In the near term, the index will target the confluence of the 50-day and 100-day SMA,s and then beyond that the 35,000 area, which stymied progress in early September.
A reversal back below 33,500 could see fresh selling pressure emerge, and then the index may target 32,800 once more.
Dow Jones Daily Price Chart
How do Daily and Weekly Sentiment Changes Affect the Dow Jones?
| Change in | Longs | Shorts | OI |
| Daily | -4% | 15% | 6% |
| Weekly | -16% | 26% | 4% |
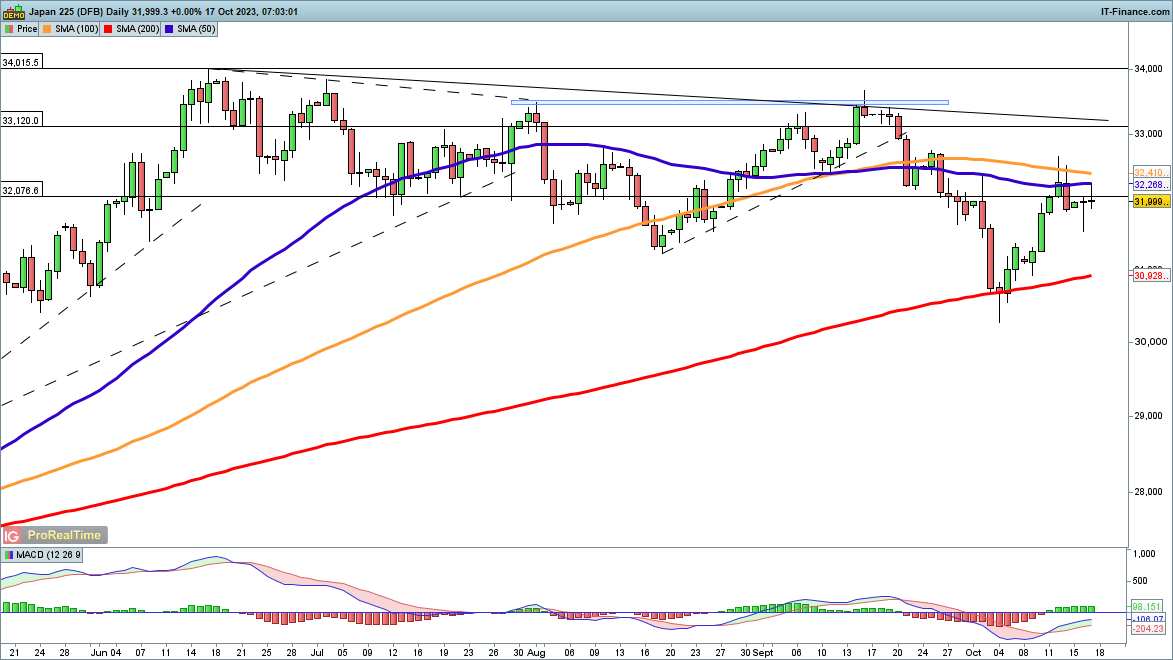
Nikkei 225 rebound slows
Japanese stocks fell sharply in their cash session on Monday, but futures rebounded during the US session, with some positive momentum continuing into Tuesday. This seems to have stalled the downward move for the time being, and now the index will look towards the 32,500 level, which contained upside progress last week.
From there, the price may move on towards 33,500, the highs from early September. A close back below 31,500 would open the way to another test of the 200-day SMA.
Nikkei 225 Daily Price Chart
See our Q4 Top Trading Opportunities
Recommended by IG
Get Your Free Top Trading Opportunities Forecast
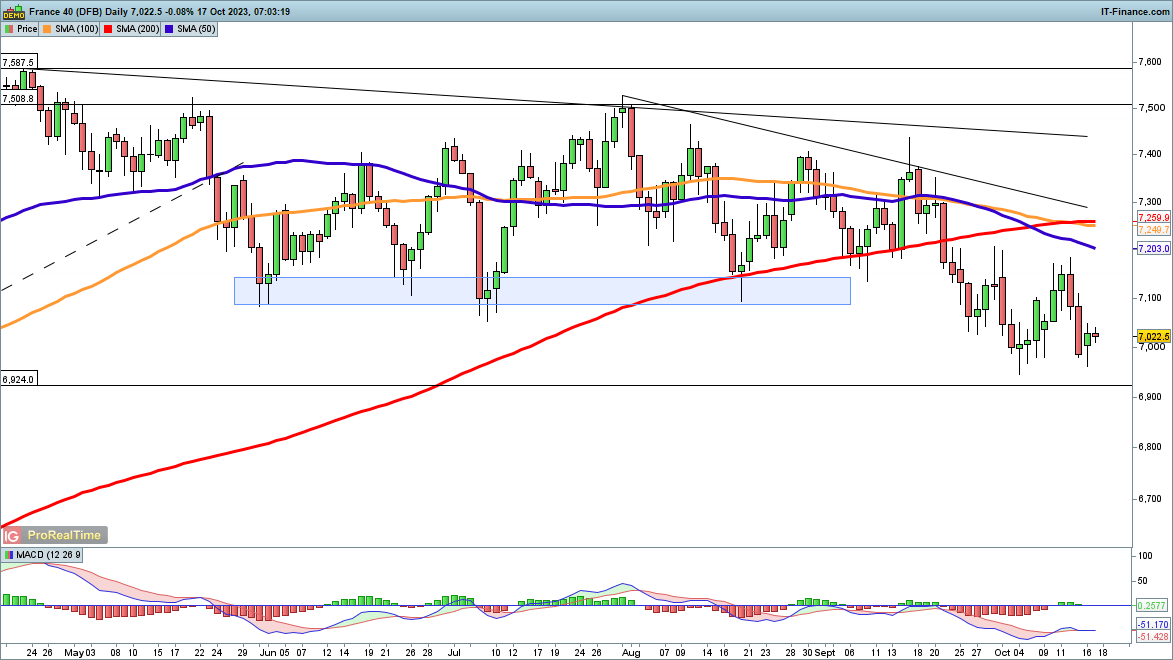
CAC 40 back above 7000
The index gave back all the gains made in early October in two sessions last week, but it managed to stabilize above 7000 on Monday. However, the price will need to close above 7210 to suggest that a short-term low has been formed; price action since mid-September has seen selling pressure appear in this area, holding back upside progress. From there a move back to trendline resistance from the July highs could be contemplated.
For the moment the selling appears to have paused, but a close below the late September low around 6944 could mark the beginning of a more bearish view.
CAC 40 Daily Price Chart