Gold, XAU/USD, US Dollar, Fed, FOMC, Treasury Yields, Real Yields, GVZ Index – Talking Points
- The gold price leapt to new highs as haven demand continues
- The psychological US$ 2,000 mark has been eclipsed with volatility ticking up
- The FOMC meeting lies ahead. Will it provide price swings for XAU/USD?
Recommended by Daniel McCarthy
Get Your Free Gold Forecast
The spot gold price cleared the psychological US$ 2,000 level last Friday as markets prepare for this week’s Federal Open Market Committee (FOMC) meeting that will conclude on Wednesday.
Treasury yields have eased from recent peaks but remain elevated with the benchmark 10-year bond trading at 5.02% last week, its highest yield since 2007. It consequently raced back down toward 4.80% and has seen whippy price action since.
The run-up in the return on US Government debt has helped to underpin the US Dollar. In addition, perceived haven assets such as USD and gold have appreciated with the geopolitical situation in the Middle East assisting to undermine growth and risk-orientated assets.
In loose terms, when the US Dollar and Treasury yields rise, gold sometimes comes under selling pressure. Similarly, when US real yields are advancing, gold occasionally slips as it is a non-interest-bearing asset.
US real yields have been on the march higher through 2023 and recently stretched to a 15-year peak at the 10-year part of the curve, trading above 2.60%.
The real yield is the nominal yield less the market-priced inflation rate derived from Treasury inflation-protected securities (TIPS) for the same tenor.
A combination of higher nominal yields and an easing of inflation expectations has boosted it in this latest surge.
Looking at the chart below, the elevated 10-year Treasury yields, real yields and DXY (USD) index are yet to impact the gold price, but it might be worth watching should those markets move abruptly.
The interest rate market is pricing no change for the Fed funds target rate at Wednesday’s FOMC conclave but the post-decision discussion from Fed Chair Jerome Powell could provide some impetus for the gold price. To learn more about the impact that central banks have on markets, click on the banner.
Recommended by Daniel McCarthy
Traits of Successful Traders
SPOT GOLD, DXY (USD) INDEX, US 10-YEAR TREASURY AND REAL YIELD
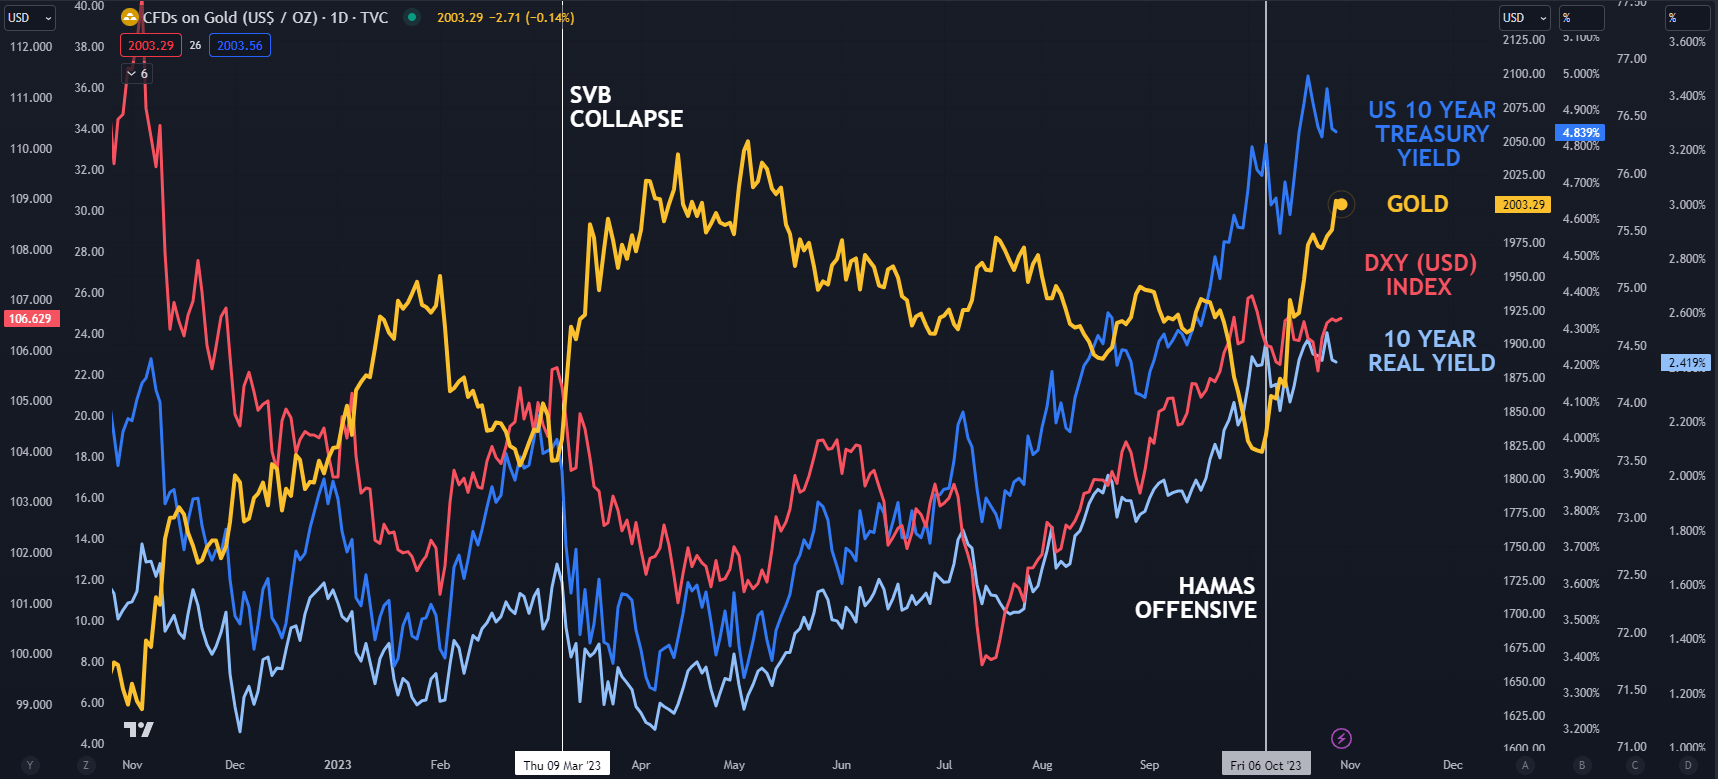
Chart created in TradingView
All this price action across markets has seen gold volatility tick higher as measured by the GVZ index. The GVZ index measures implied volatility in the gold price in a similar way that the VIX index gauges volatility in the S&P 500.
At the same time, the width of the 21-day simple moving average (SMA) based Bollinger Bands. has expanded. The Bolling Bands represent historical volatility.
Recommended by Daniel McCarthy
How to Trade Gold
SPOT GOLD, BOLLINGER BANDS AND GVZ INDEX
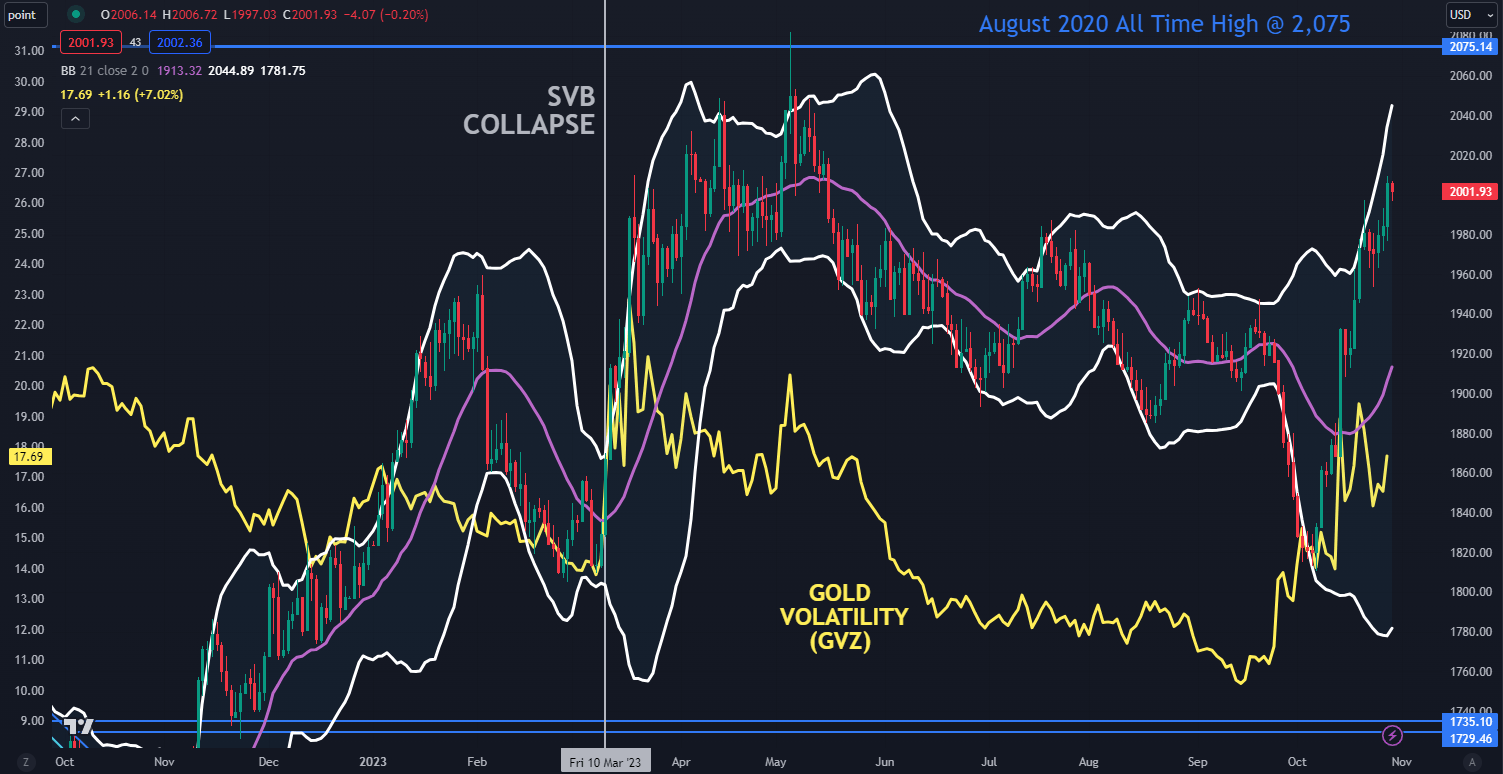
Chart created in TradingView
Trade Smarter – Sign up for the DailyFX Newsletter
Receive timely and compelling market commentary from the DailyFX team
Subscribe to Newsletter
— Written by Daniel McCarthy, Strategist for DailyFX.com
Please contact Daniel via @DanMcCathyFX on Twitter