EUR/USD, AUD/USD OUTLOOK:
- Traders will closely watch U.S. GDP data on Thursday
- The U.S. economy is forecast to have grown by 4.3% in the third quarter
- Strong economic activity numbers could boost the U.S. dollar, sending both EUR/USD and AUD/USD sharply lower
Most Read: USD/CAD Fails to Sustain Breakout after Bank of Canada Decision. What’s Next?
The U.S. Bureau of Economic Analysis will release preliminary gross domestic product data on Thursday. The median estimate suggests that the American economy grew at an annualized pace of 4.3% in the third quarter, although several investment banks are forecasting a stronger expansion above 5.0% on solid personal consumption expenditures, which likely surged 4.5% during the period under review.
Economic resilience may assuage concerns about the health of the business cycle, but it is unlikely to affect the FOMC’s peak rate outlook in light of recent messaging. For context, the Fed has sort of adopted a more cautious approach, with an increasing number of officials questioning the necessity of additional hikes after 525 basis points of cumulative tightening since 2022.
FOMC MEETING PROBABILITIES
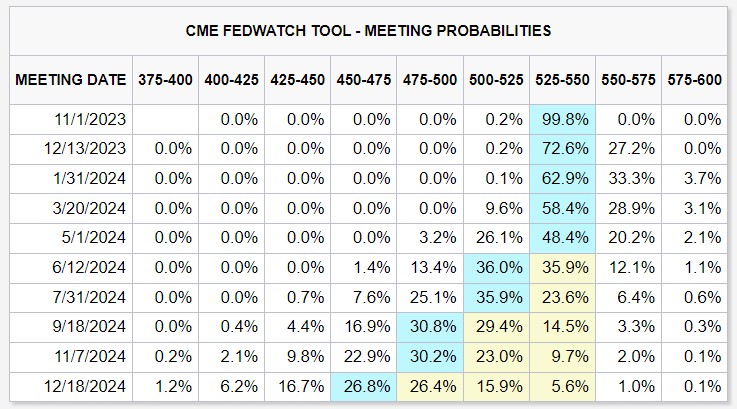
Source: CME Group
Wondering about the outlook for EUR/USD and the essential market catalysts to monitor? All this information is available in our Euro Q4 Trading Guide. Download it today!
Recommended by Diego Colman
Get Your Free EUR Forecast
While a solid GDP print may not lead investors to price in another Fed adjustment for 2023, it will reinforce expectations that policymakers will maintain a restrictive stance for an extended period, meaning higher interest rates for longer. This scenario could exert upward pressure on yields, particularly those at the long end, creating a constructive backdrop for the U.S. dollar.
With the greenback riding a wave of bullish momentum, it’s conceivable that EUR/USD and AUD/USD could experience additional losses in the near term. This article offers a comprehensive analysis of the potential direction for these two currency pairs.
UPCOMING US ECONOMIC DATA
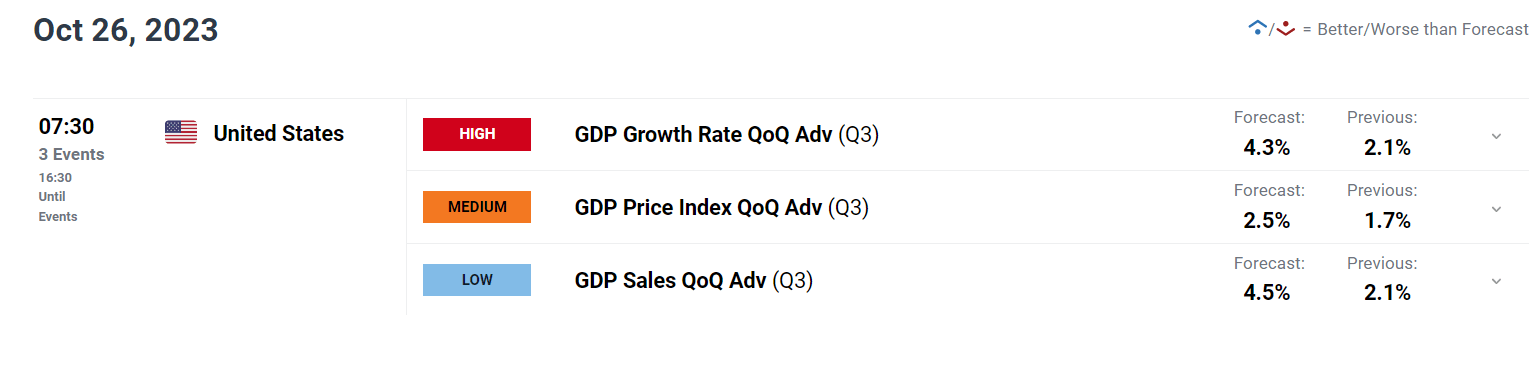
Source: DailyFX Economic Calendar
Keen to understand the role of retail positioning in EUR/USD’s price action dynamics? Our sentiment guide delivers all the essential insights. Get your free copy today!
| Change in | Longs | Shorts | OI |
| Daily | 5% | 6% | 6% |
| Weekly | -1% | 2% | 0% |
EUR/USD TECHNICAL ANALYSIS
EUR/USD extended its decline on Wednesday after a fakeout earlier in the week, with sellers back in control of the market. If losses gain momentum in the coming trading sessions, the first floor to keep an eye on is located around 1.0550. Further down the line, the focus shifts to trendline support at 1.0510, followed by this year’s lows nestled slightly below the 1.05 handle.
On the flip side, if the bulls stage a comeback and manage to push prices higher, overhead resistance is positioned at 1.0625, and 1.0675 thereafter, which corresponds to the 50-day simple moving average. In the event of additional gains, market attention will transition to 1.0765, the 38.2% Fibonacci retracement of the July/October selloff.
EUR/USD TECHNICAL CHART
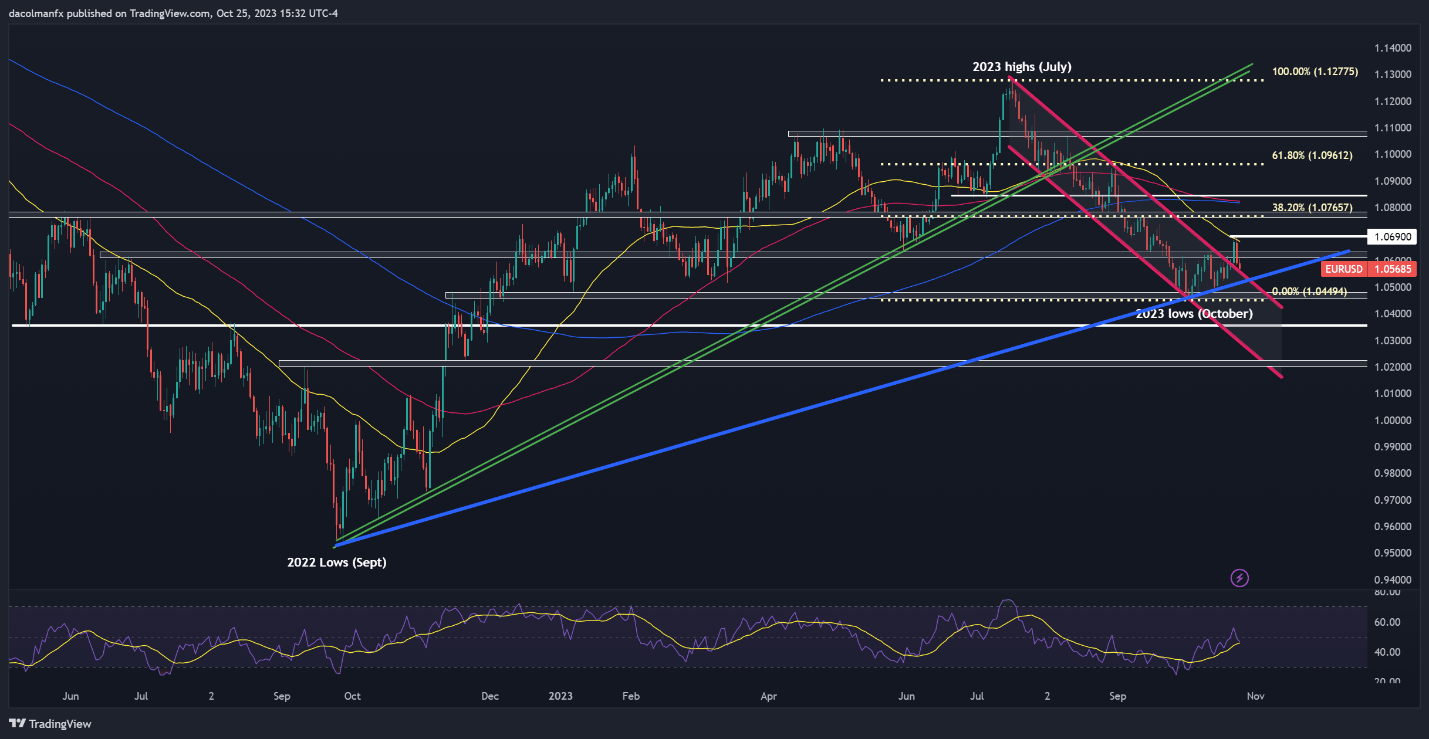
EUR/USD Chart Created Using TradingView
Looking for informative insights into where the Australian Dollar is headed and the crucial market drivers to keep on your radar? Explore the answers in our Q4 trading guide. Grab a copy today!
Recommended by Diego Colman
Get Your Free AUD Forecast
AUD/USD TECHNICAL ANALYSIS
After failing to clear cluster resistance located a touch below the psychological 0.6400 level earlier in the trading session, AUD/USD took a sharp turn to the downside, falling rapidly towards the 2023 lows around the 0.6300 handle. While prices could find a foothold in this zone on a retest, a breakdown could open the door for a drop towards last year’s lows at 0.6170.
On the other hand, if buyers return to the charge and trigger a bullish turn, the first ceiling to consider appears at 0.6350. Upside clearance of this barrier could expose the 0.6400 mark. On further strength, buyers could become emboldened to launch an attack on 0.6460 and then 0.6510.
AUD/USD TECHNICAL CHART
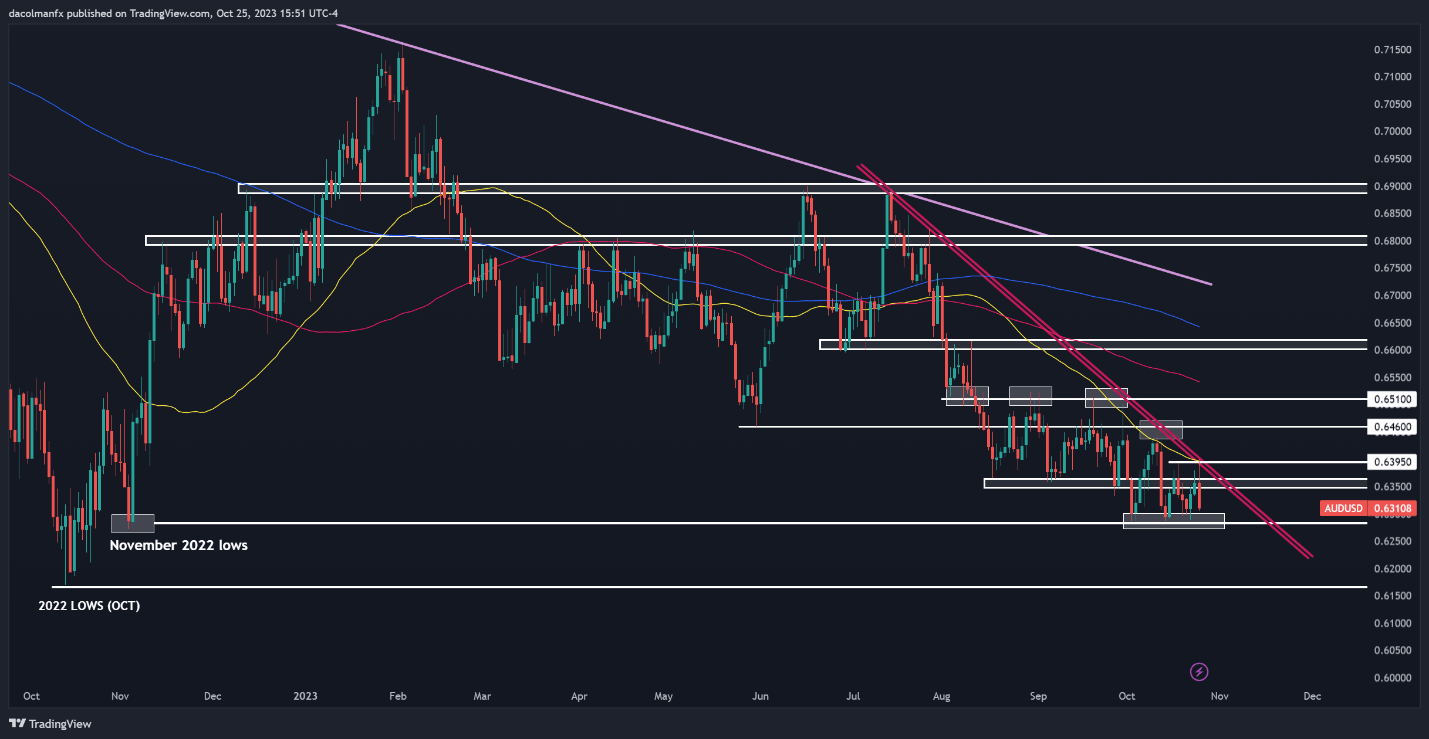
AUD/USD Chart Created Using TradingView