Article by IG Chief Market Analyst Chris Beauchamp
Dow Jones, Nasdaq 100, Nikkei 225 Analysis and Charts
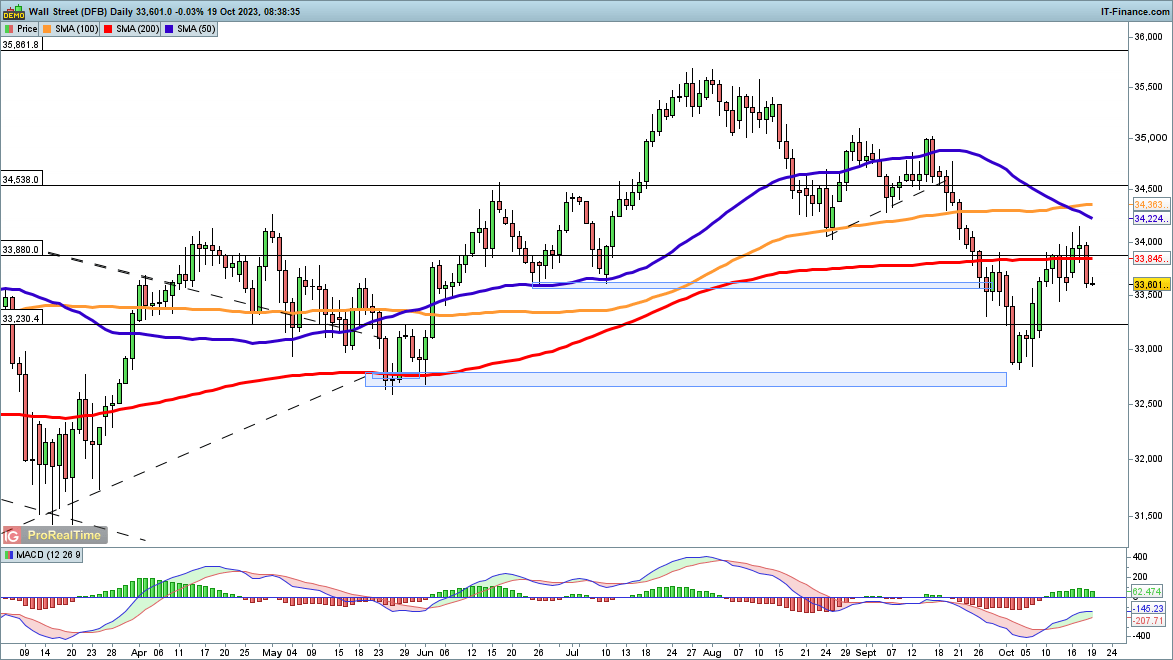
Dow back below 200-day MA
The volatile trading of the past two weeks continued on Wednesday. The index dropped back below the 200-day simple moving average (SMA), after testing the 34,000 level on Tuesday.A close below 33,400 might signal that the bounce from early October has been reversed, and a move back to October’s lows at 32,800 might then begin. The May lows around 32,730 then come into view.
Buyers need a close back above 33,800 and then above the 200-day SMA to indicate a revived rally is in progress.
Dow Jones Daily Chart

See the latest Dow Jones sentiment changes
| Change in | Longs | Shorts | OI |
| Daily | 19% | -19% | -2% |
| Weekly | 10% | -9% | 0% |
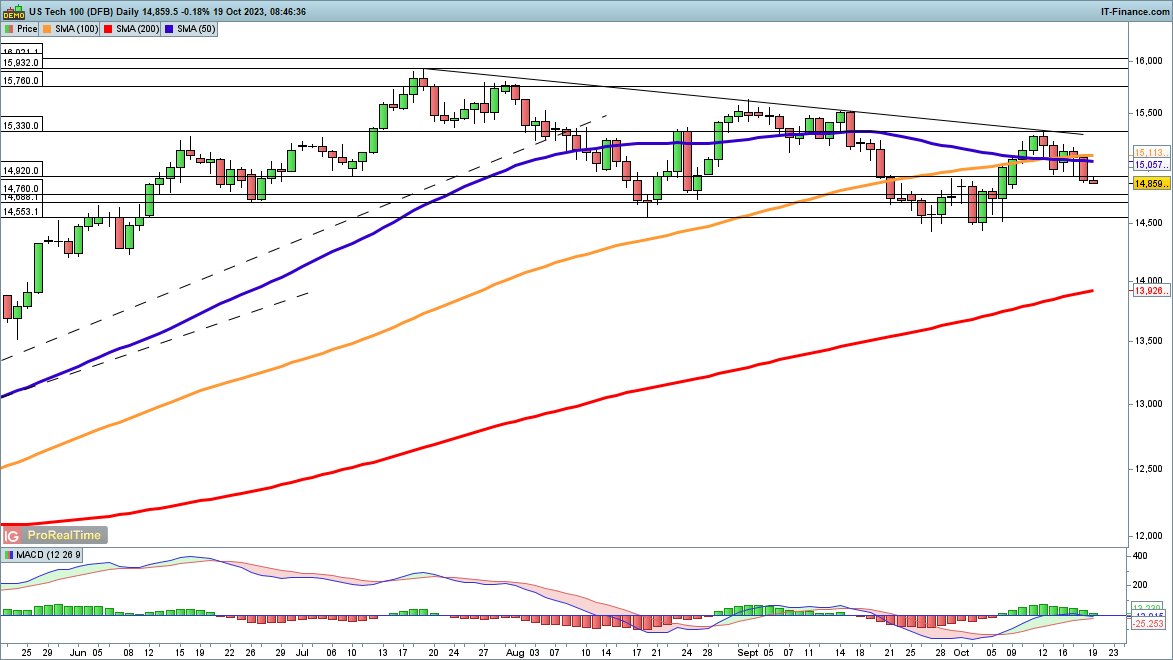
Nasdaq 100 falls back again
It has been a week since the index hit trendline resistance from the July highs, and in that time the price has slipped back below the 100- and 50-day SMAs. While the index is still some 400 points higher from the early October low, upward momentum has firmly stalled. Additional declines now target the 14,500 October low. A close below 14,400 would mark a bearish development and potentially open the way to the 200-day SMA.
Bulls will need to see a close back above 15,150 to indicate that another attempt to break trendline resistance is in play.
Nasdaq100 Daily Chart

Recommended by IG
Get Your Free Equities Forecast
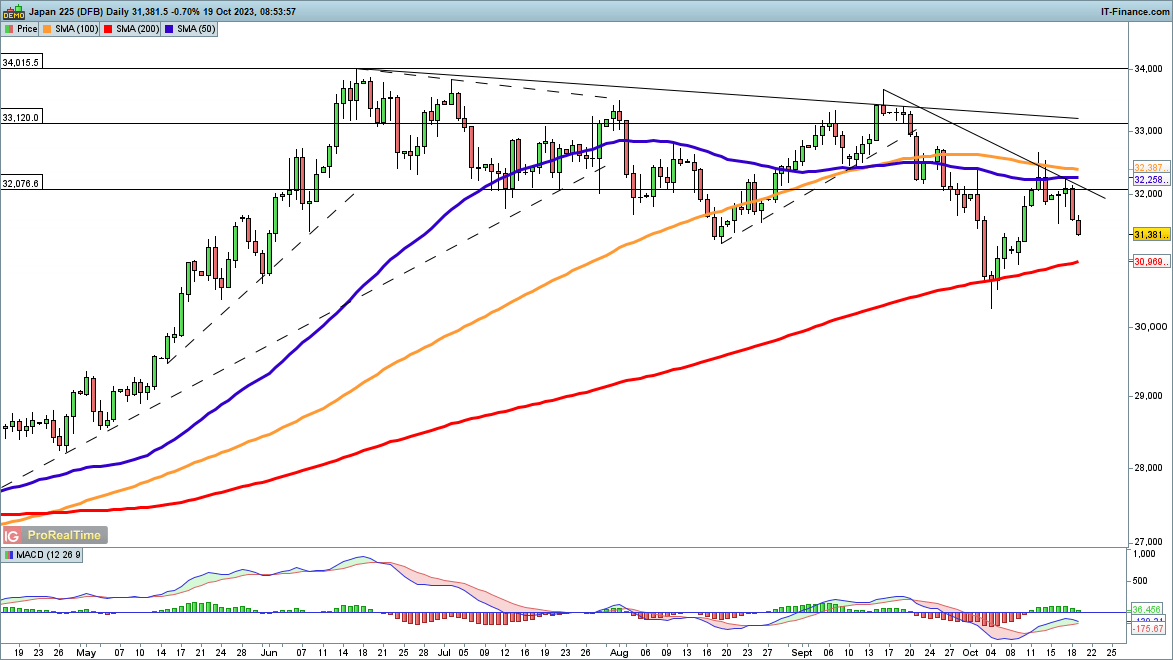
Nikkei 225 heads back towards 200-day MA
Another test of the 200-day SMA could be in prospect here, as fresh declines take the index further away from trendline resistance.The past week has seen upward momentum fizzle out, as trendline resistance from the September high and the 50- and 100-day SMAs hold back progress. Now we wait to see if the bulls can mount a defence of the 200-day SMA as they did at the end of September.
A close back above 32,200 would be needed to suggest that the bullish view has reasserted itself. Below the 200-day SMA, the price targets the September low of around 32,300.
Nikkei 225 Daily Chart
