GBP/USD News and Analysis
- Markets turn dovish on rates after Powell’s dot plot comments
- Bank of England maintains hawkish posture but worrying growth, employment data could test its resolve sooner than expected
- GBP/USD buoyed by dollar decline – meets immediate resistance via 200 SMA
- The analysis in this article makes use of chart patterns and key support and resistance levels. For more information visit our comprehensive education library
Markets Turn Dovish on Rates after Powell’s Dot Plot Comments
Despite the Fed attempting to maintain its hawkish posture, markets ultimately gravitated towards the more dovish elements of Jerome Powell’s comments in the aftermath of last week’s FOMC meeting.
The Fed acknowledged the strong performance of recent US fundamental data by upgrading the word used in the statement to describe the uptick in growth from ‘solid’ to ‘strong’. However, markets chose to prioritise the mention of ever tightening financial conditions – via elevated bond yields – and Powell’s general dismissal of the Fed dot plot efficacy. The Fed’s dot plot had previously kept hopes alive of another rate hike as it reads 6.6%, implying one more rate hike which would move the Fed funds rate to 5.5% – 5.75%.
The broader market perceived this as a sign the Fed’s pause is more like a hold, suggesting US interest rates have peaked. Bond yields dropped sharply but remain elevated. As one would expect, the US dollar also witnessed a sizeable decline into the end of the week, buoyed by softer jobs data.
The Bank of England, on the other hand issues a rather straightforward meeting and presser although, three of the nine monetary policy committee members voted for another 25 basis point hike. The UK has already been witnessing unemployment rising steadily and the prospect of zero growth in 2024 sets UK citizens up for a challenging year ahead.
Recommended by Richard Snow
How to Trade GBP/USD
GBP/USD buoyed by dollar decline – meets immediate resistance via 200 SMA
GBP/USD rose through prior support/resistance of 1.2200 and 1.2345 as the dollar and US yields turned sharply lower. Sterling has few bullish drivers apart from rate cut expectations where markets estimate the BoE will only consider rate cuts in Q3 of next year – outlasting estimates for the Fed which have recently crept into Q2 2024.
Therefore, the start of this week may pose a challenge to GBP/USD if the dollar selloff stalls. Something else to note will be Fed officials and whether they issue a response to the apparent risk off sentiment. Jerome Powell makes two appearances this week, the most notable on Thursday where he will take part in a panel discussion.
GBP/USD Daily Chart
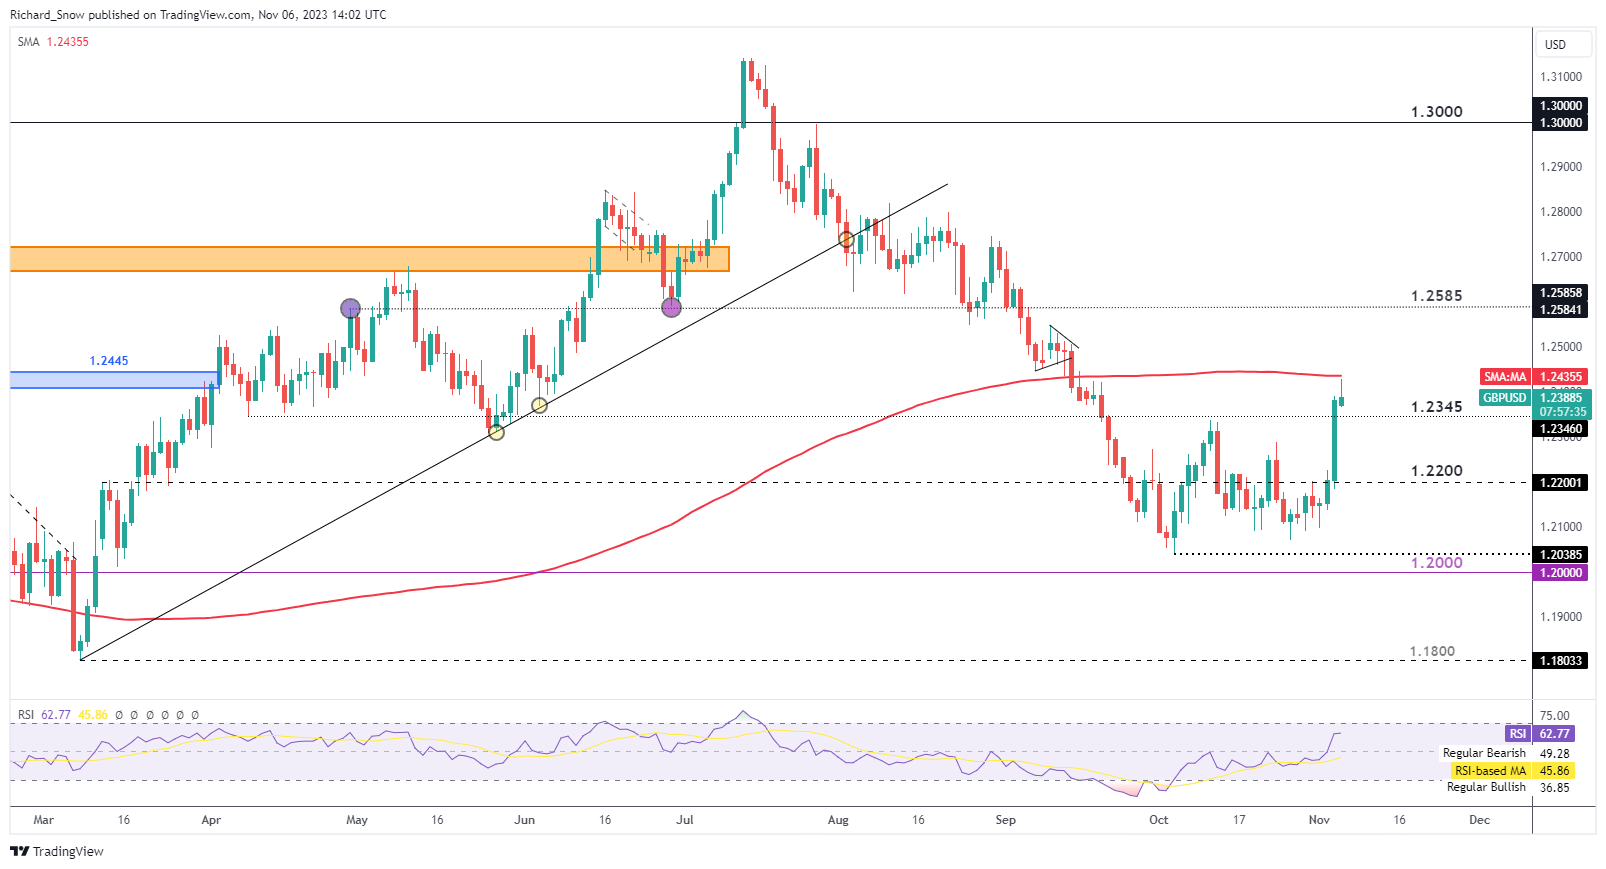
Source: TradingView, prepared by Richard Snow
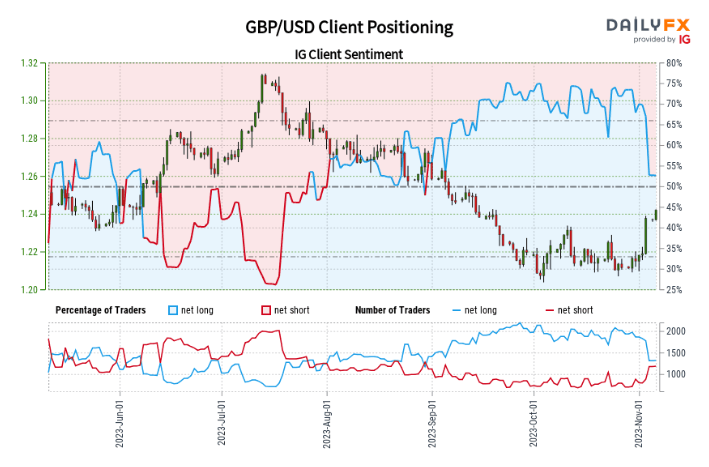
GBP/USD:Retail trader data shows 52.13% of traders are net-long with the ratio of traders long to short at 1.09 to 1. We typically take a contrarian view to crowd sentiment, and the fact traders are net-long suggests GBP/USD prices may continue to fall.
Find out how to read and incorporate IG client sentiment into your own trading process. Claim this guide below:
| Change in | Longs | Shorts | OI |
| Daily | 8% | 12% | 10% |
| Weekly | -28% | 54% | -3% |
Major Risk Events for the Week Ahead
As mentioned, Fed representatives will have their say with most appearances scheduled for Tuesday and Wednesday. Then on Friday, UK GDP is due.
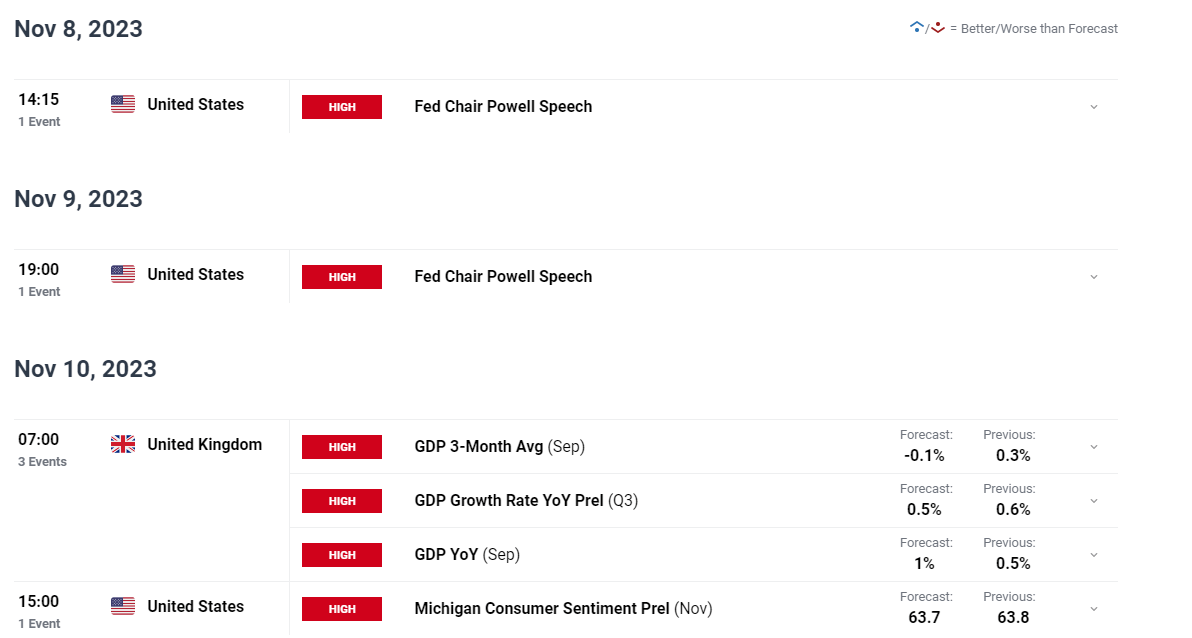
Customize and filter live economic data via our DailyFX economic calendar
— Written by Richard Snow for DailyFX.com
Contact and follow Richard on Twitter: @RichardSnowFX