بروزرسانی: 17 آذر 1404
Dow, Nasdaq 100 and Nikkei 225 Steady after Wednesday’s Losses
Article by IG Chief Market Analyst Chris Beauchamp
Dow Jones, Nasdaq 100, Nikkei 225 - Analysis and Charts
\u200b\u200b\u200bDow hits an air pocket
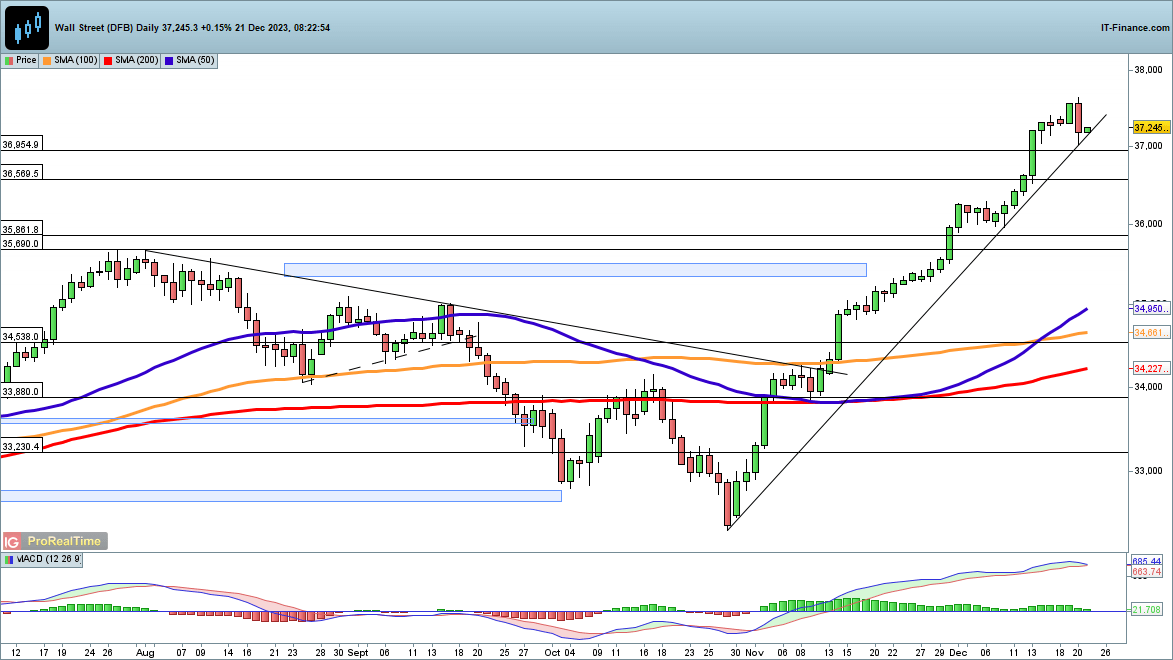
\u200bAfter the huge gains made since the end of October, yesterday’s drop came as a surprise. \u200bBut with volumes low and newsflow almost absent, it was perhaps not surprising that some profit-taking occurred, although the price continues to hold uptrend support from the lows of October.
\u200bA close below 37,000 could yet see a move serious pullback develop, though a rally back above 37,500 puts more record highs on the agenda.
Dow Jones Daily Chart
See how changes in daily and weekly sentiment affect price action
| Change in | Longs | Shorts | OI |
| Daily | -18% | -9% | -11% |
| Weekly | -24% | 2% | -5% |
\u200b
\u200bNasdaq 100 steadies after drop
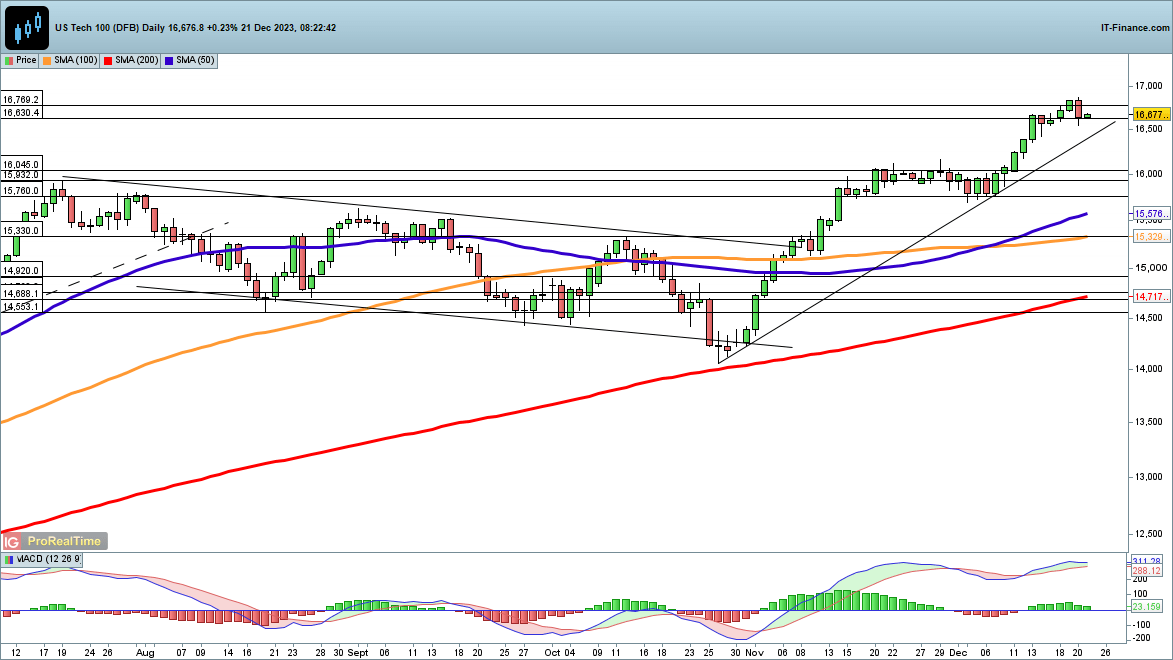
\u200bThis index also suffered a drop, though it only took the price back to the levels seen earlier in the week.\u200bThis week has seen the index hit a fresh record high, and despite yesterday’s brief volatility momentum still leans towards the upside.
\u200bA close below trendline support from the October lows could spark more selling and see the price head back toward the 16,000 area, where the price consolidated in November.
Nasdaq 100 Daily Chart
Recommended by IG
The Fundamentals of Trend Trading
\u200b
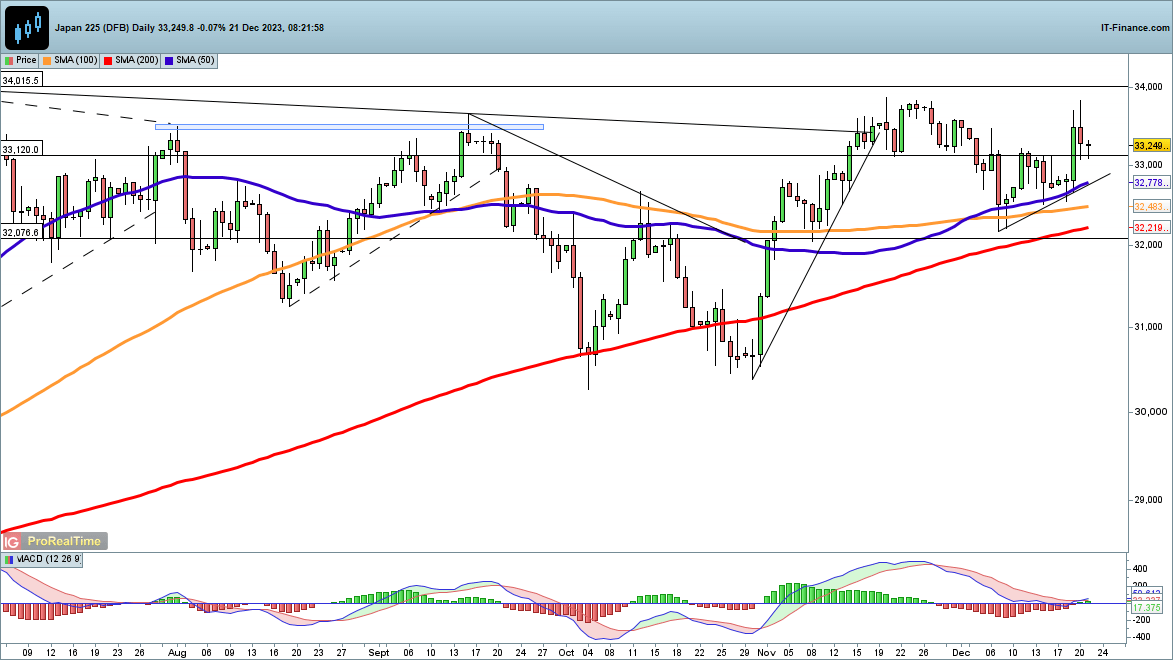
\u200bNikkei 225 stuck below 33,500
\u200bSellers have held back the price from making further headway above 33,500 this week.\u200bFor the moment, the price has yet to retest the 50-day SMA or rising trendline support from the December low. A close back above 33,500 means another test of the 33,900/34,000 zone could be in play.
\u200bA close back below 32,750 would be needed to put further bearish pressure on the index.
Nikkei 225 Daily Chart
منبع